Fig. 3
Download original image
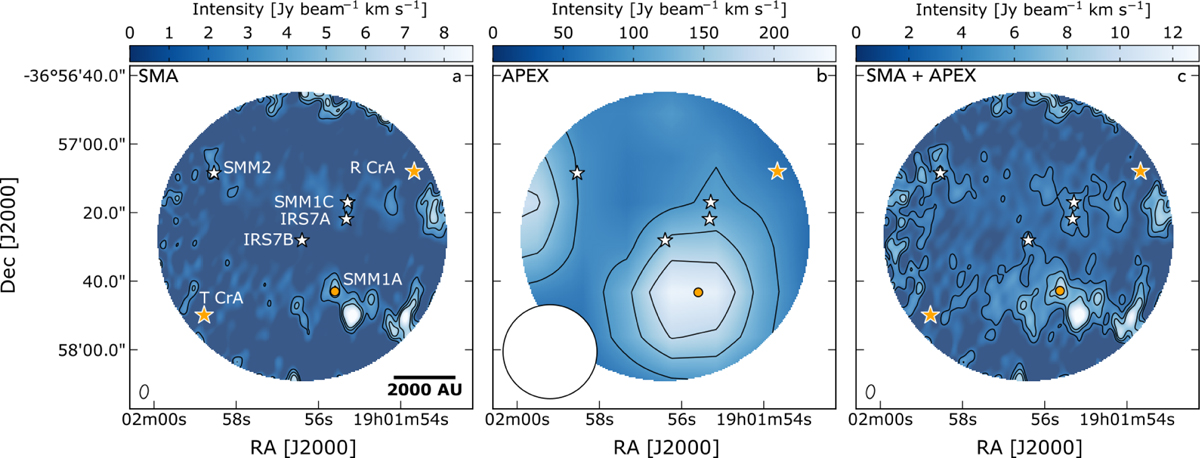
Primary beam corrected integrated intensity maps for CH3OH J = 50−40 A+ transition (Eu = 34.8 K) at 241.791 GHz detected by the SMA (a), by the APEX telescope (b), and in the combined interferometric SMA and single-dish APEX data (c). All lines are integrated between 6 and 12.5 km s−1. Contours start at 5σ (σSMA= 0.16 Jy beam−1 km s−1, σAPEX= 2 Jy beam−1 km s−1, σSMA+APEX = 0.17 Jy beam−1 km s−1 ) and follow in steps of 5σ. The circular field-of-view corresponds to the primary beam of the SMA observations. The synthesised beams are displayed in white in the bottom left corner of each panel.
Current usage metrics show cumulative count of Article Views (full-text article views including HTML views, PDF and ePub downloads, according to the available data) and Abstracts Views on Vision4Press platform.
Data correspond to usage on the plateform after 2015. The current usage metrics is available 48-96 hours after online publication and is updated daily on week days.
Initial download of the metrics may take a while.