Fig. 2
Download original image
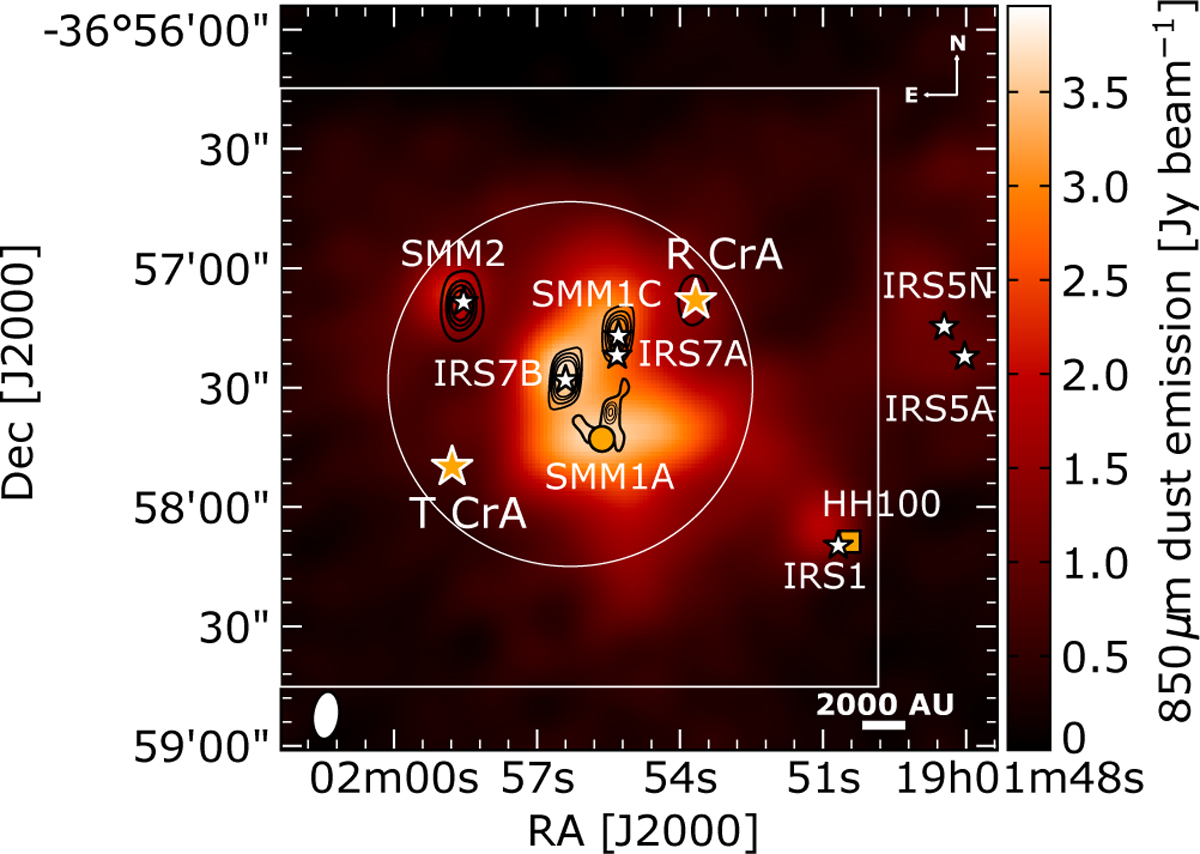
SMA continuum at 1.3 mm (contours) overlaid with SCUBA 850 µm density flux from Nutter et al. (2005). The contours start at 5σ and continue in steps of 5σ (σ = 18 mJy beam−1). The empty circle indicates the size of the SMA primary beam, whereas the SMA synthesised beam is shown with a white ellipse in the bottom left corner. The empty rectangle shows the map covered by APEX observations. The stars mark the position of the objects located in the Coronet cluster; refer to Table 1 for their identification.
Current usage metrics show cumulative count of Article Views (full-text article views including HTML views, PDF and ePub downloads, according to the available data) and Abstracts Views on Vision4Press platform.
Data correspond to usage on the plateform after 2015. The current usage metrics is available 48-96 hours after online publication and is updated daily on week days.
Initial download of the metrics may take a while.