Fig. B.5
Download original image
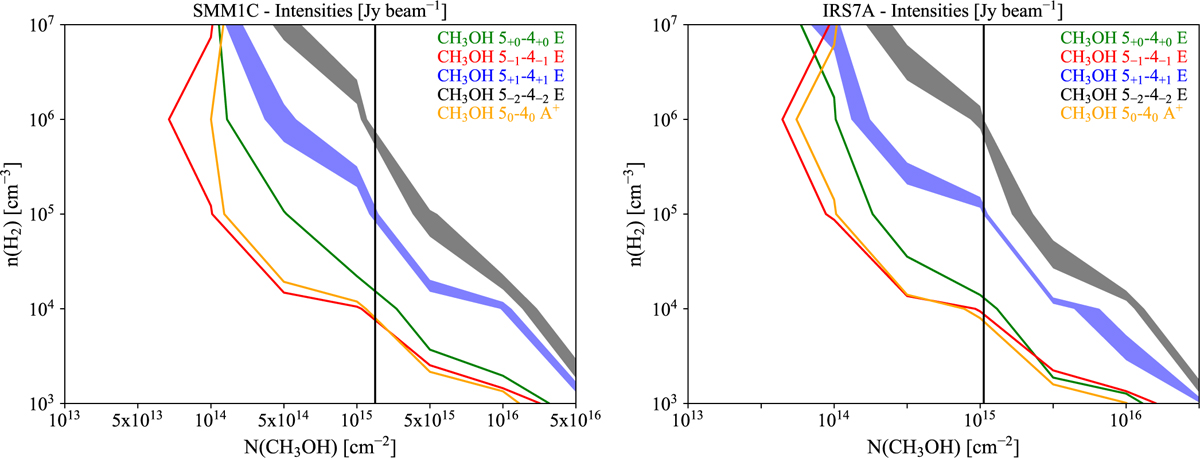
RADEX model results for the observed CH3OH lines towards SMM1C (left) and IRS7A (right), using Tkin = 30 K. Red, orange and green contours represent lower limits for the integrated line intensities of optically thick lines whereas blue and grey contours represent the marginally optically thin lines and include the errors from Table B.1. The vertical line is the CH3OH column density calculated assuming LTE conditions and optically thin emission reported in Table 3.
Current usage metrics show cumulative count of Article Views (full-text article views including HTML views, PDF and ePub downloads, according to the available data) and Abstracts Views on Vision4Press platform.
Data correspond to usage on the plateform after 2015. The current usage metrics is available 48-96 hours after online publication and is updated daily on week days.
Initial download of the metrics may take a while.