Open Access
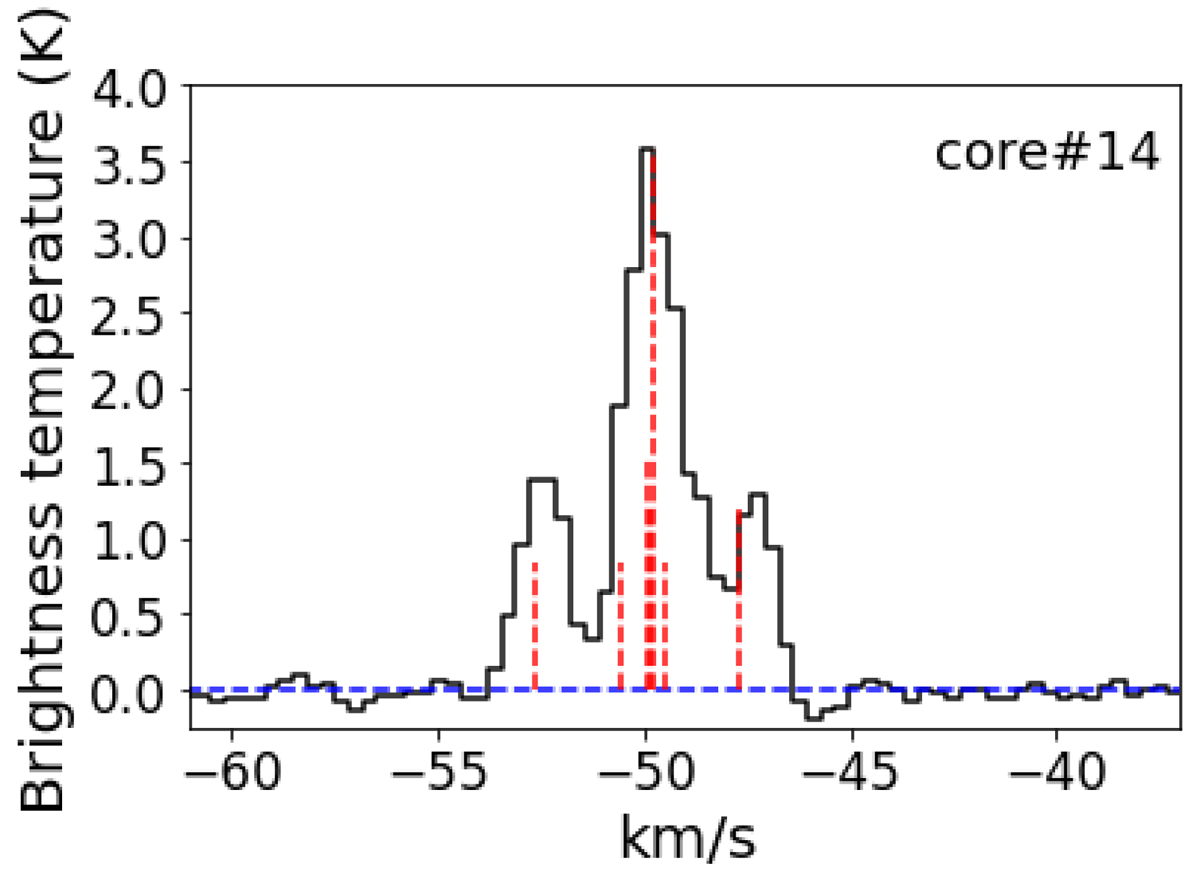
Fig. E.2.
Download original image
Example of the DCN (3-2) core-averaged, background-subtracted spectrum extracted for core 14, in G333.60 with the DCN hyperfine model (see Table E.2) overlaid in red vertical dashed lines and are set relative to the central core VLSR.
Current usage metrics show cumulative count of Article Views (full-text article views including HTML views, PDF and ePub downloads, according to the available data) and Abstracts Views on Vision4Press platform.
Data correspond to usage on the plateform after 2015. The current usage metrics is available 48-96 hours after online publication and is updated daily on week days.
Initial download of the metrics may take a while.