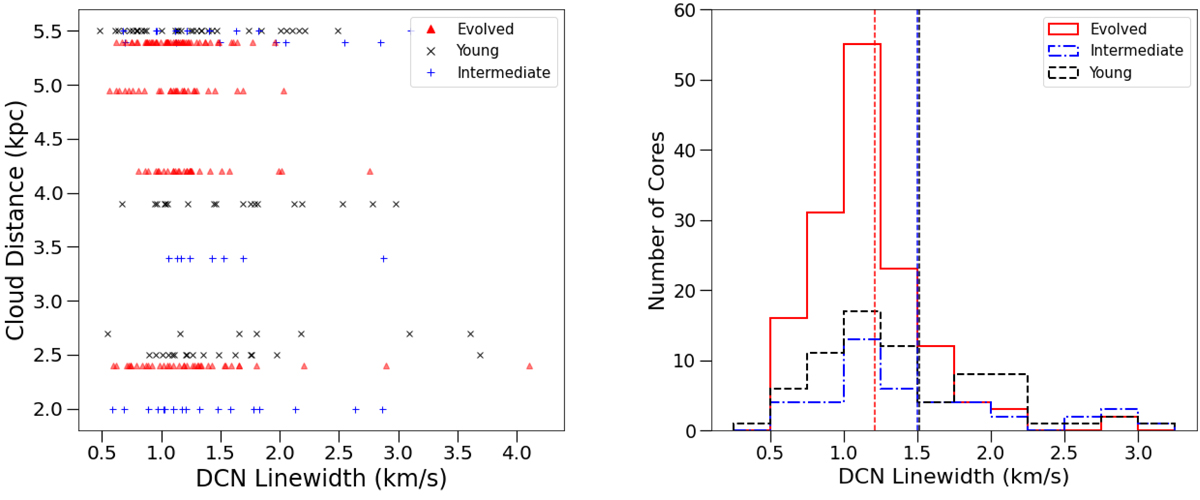
Fig. 15.
Download original image
Distribution of the core linewidths from DCN single-type line fits as a function of protocluster distance (left). The red triangles, blue plusses, and black crosses represent the linewidths of core emission associated with evolved, intermediate, and young protoclusters, respectively. There is no obvious dependence on the protocluster distance and the linewidths. Right: Histogram of the linewidths from the DCN line fits grouped by evolutionary stage, where the solid red, blue dot-dashed, and black dashed lines represent the evolved, intermediate, and young protoclusters, respectively. The vertical lines display the mean linewidth for each evolutionary stage with the same colours described above. The evolved regions have a slightly smaller average linewidth (1.2 km s−1) than young and intermediate regions (∼1.5 km s−1), significant within the standard errors.
Current usage metrics show cumulative count of Article Views (full-text article views including HTML views, PDF and ePub downloads, according to the available data) and Abstracts Views on Vision4Press platform.
Data correspond to usage on the plateform after 2015. The current usage metrics is available 48-96 hours after online publication and is updated daily on week days.
Initial download of the metrics may take a while.