Fig. 9.
Download original image
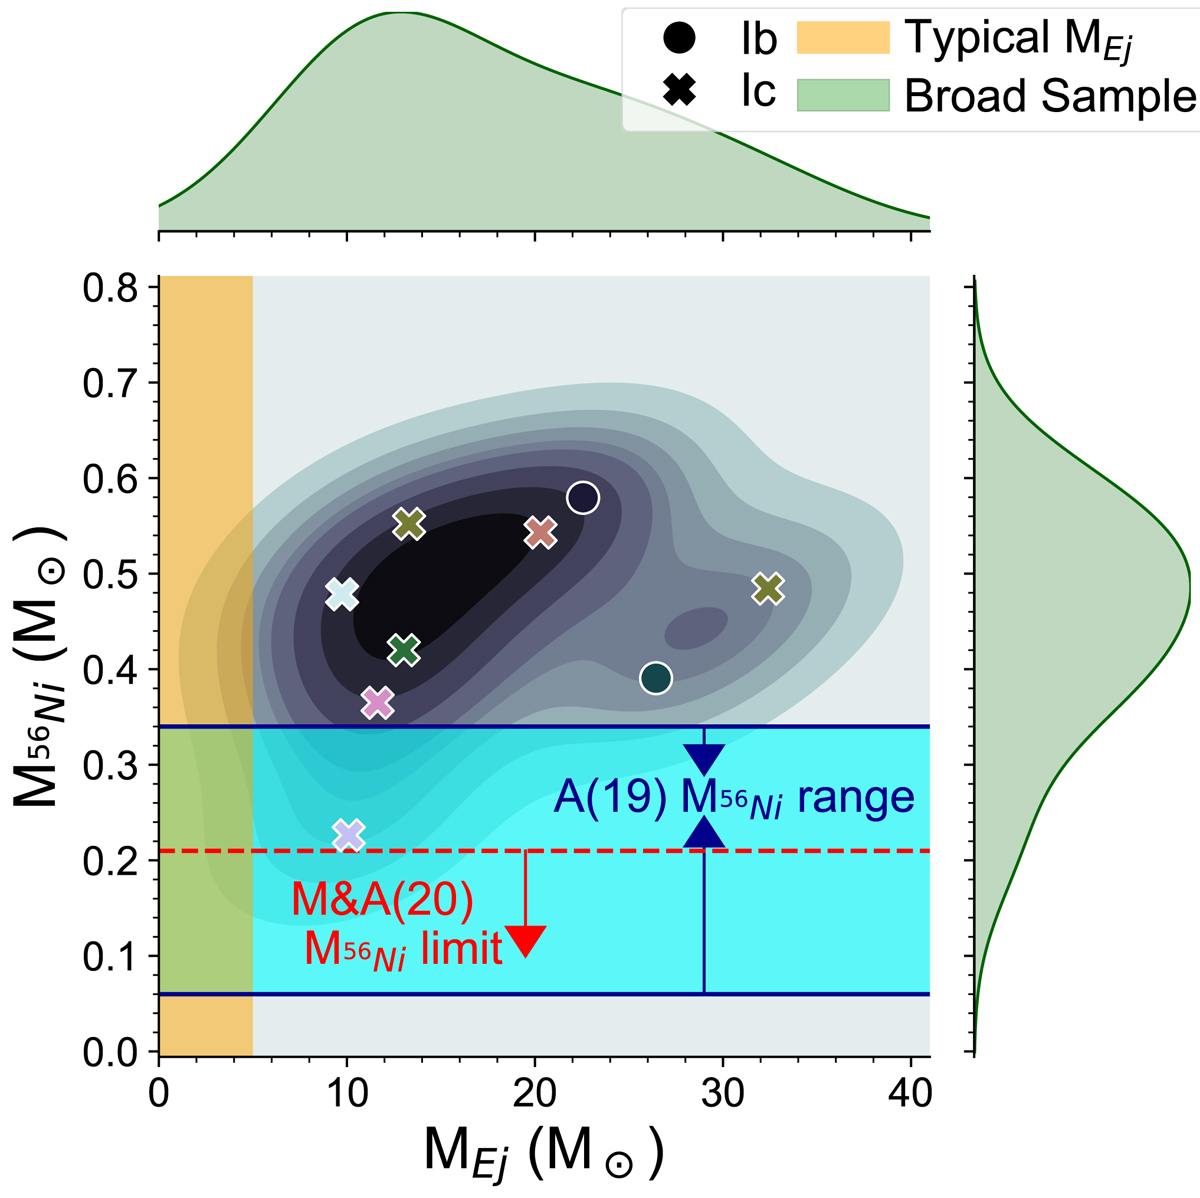
Ejecta and nickel masses obtained from simple Arnett fitting. SNe colors are same as in previous figures. Margins show the distribution of the individual parameter as a KDE (ejecta mass on top, nickel mass to the right). The lower ejecta mass fit of PTF11mnb is from a fit to the peak only (blue line in Fig. E.3), while the fit to its entire lightcurve is the highest ejecta mass (≳30 M⊙) green cross. The orange region shows the typical range of ejecta masses for ordinary literature SE SNe (Sect. 5.4). The red dashed line labeled M&A(20) is the upper limit of the nickel mass distribution of SE SNe in Meza & Anderson (2020), discussed in Sect. 8.6. The cyan region with blue arrows labeled A(19) shows the mean and standard deviation of literature Type Ibc nickel masses in Anderson (2019), see Sect. 5.5.
Current usage metrics show cumulative count of Article Views (full-text article views including HTML views, PDF and ePub downloads, according to the available data) and Abstracts Views on Vision4Press platform.
Data correspond to usage on the plateform after 2015. The current usage metrics is available 48-96 hours after online publication and is updated daily on week days.
Initial download of the metrics may take a while.