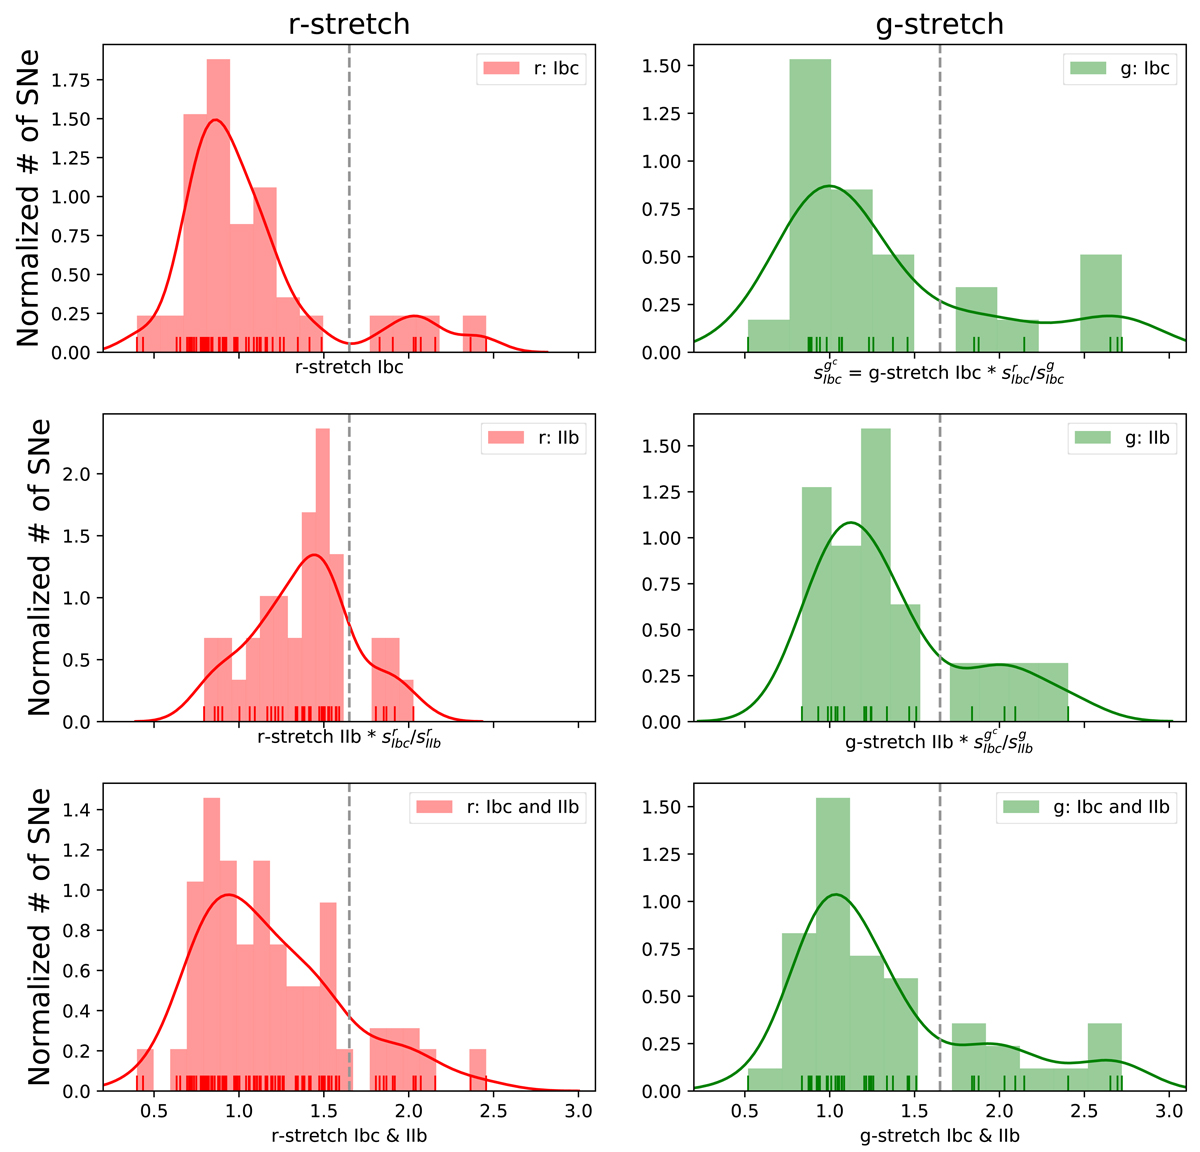
Fig. 2.
Download original image
Normalized histogram of stretch parameter measured in r (left) and g (right panels) bands. A kernel density estimate using a Gaussian kernel, which shows an estimate of the continuous density, has been over-plotted as a line of matching color. Each measurement is also indicated with a tick mark. All values have been corrected to the space of top: Type Ibc r-band template stretch values by deriving a stretch correction factor to the Type Ibc r-band template by fitting the other templates (see text). Stretch = 1.65 is marked with a gray dashed-line. Plotted normalized with respect to the total counts and bin width. Results from Appendix B have been added to construct the same for middle: Type IIb SNe, bottom: combined Type Ibc and IIb SNe.
Current usage metrics show cumulative count of Article Views (full-text article views including HTML views, PDF and ePub downloads, according to the available data) and Abstracts Views on Vision4Press platform.
Data correspond to usage on the plateform after 2015. The current usage metrics is available 48-96 hours after online publication and is updated daily on week days.
Initial download of the metrics may take a while.