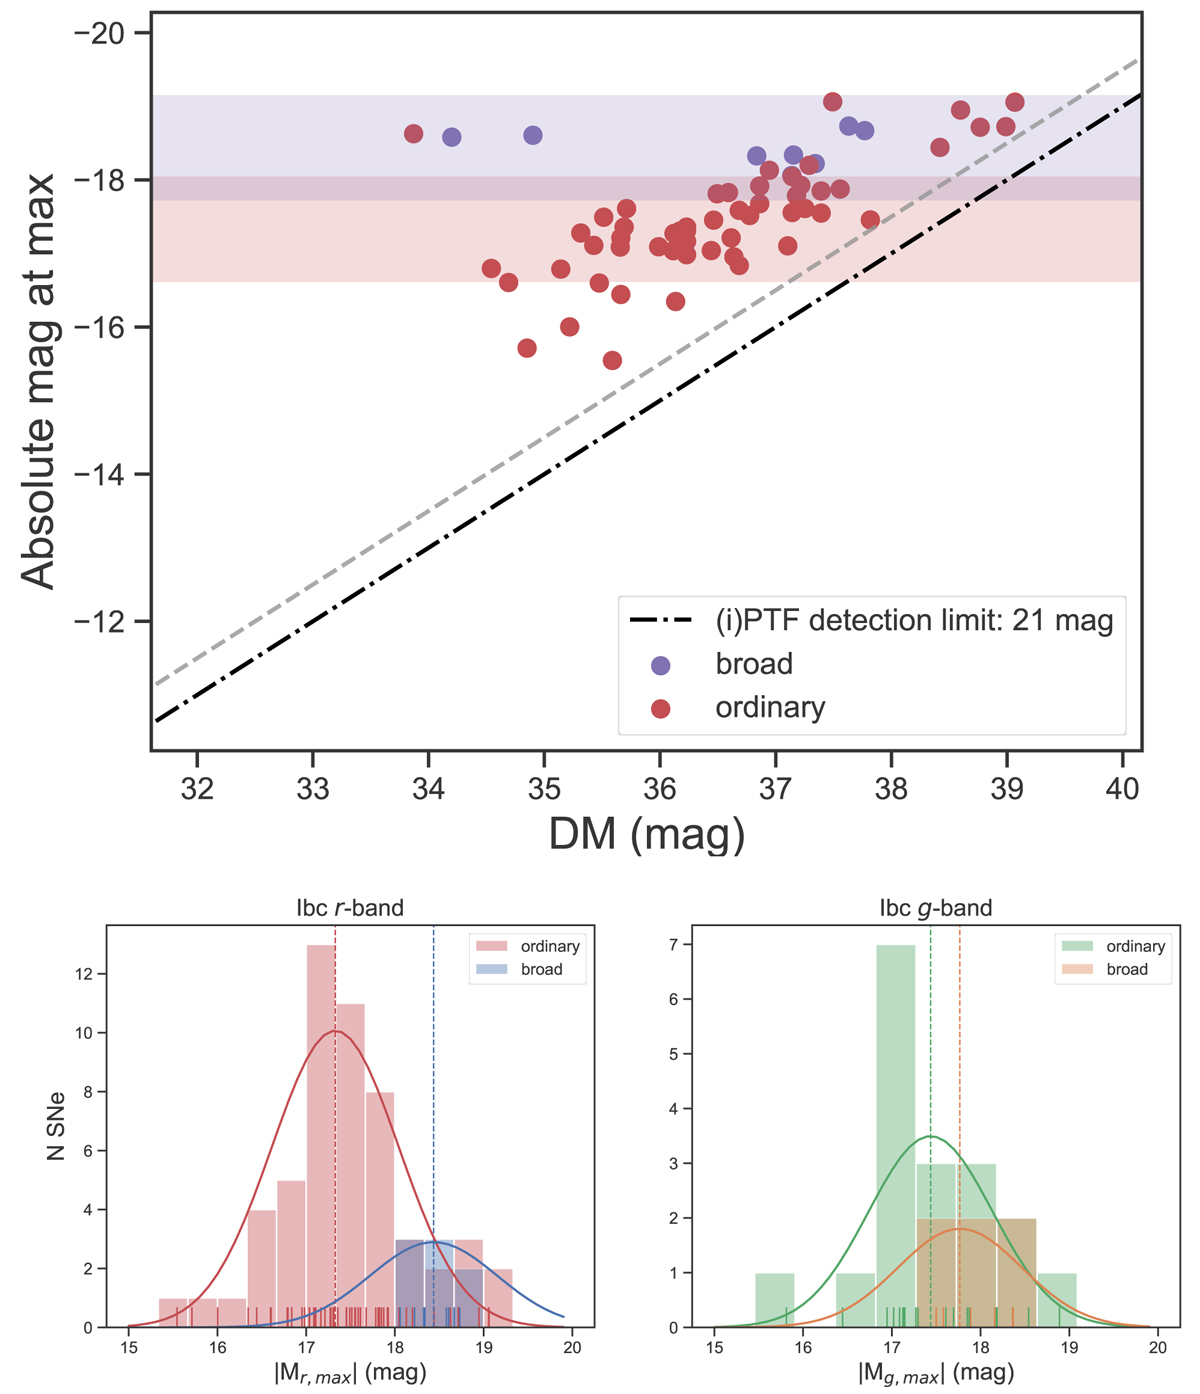
Fig. C.1.
Download original image
Top: Peak absolute magnitude in r band versus distance modulus (DM) for ordinary (red circles) and broad (purple circles) SE SNe, which display the Malmquist bias associated with the (i)PTF detection limit thresholds. The detection thresholds at r = 20.5 mag and r = 21.0 mag are plotted as gray dashed and black dot-dashed lines, respectively. They are approximate estimates of the detection threshold for (i)PTF during bright and dark times, respectively. This plot shows that the broad SNe are preferentially brighter than the ordinary SE SNe, meaning that they are detected at a higher fraction at higher redshifts. Bottom: Histogram of peak magnitude with the gaussian fits overlaid for the broad and ordinary groups in g and r bands. This type of distribution is often referred to as a truncated distribution (Feigelson & Babu 2012), and correcting for this truncation is a complicated but necessary step for all magnitude-limited surveys.
Current usage metrics show cumulative count of Article Views (full-text article views including HTML views, PDF and ePub downloads, according to the available data) and Abstracts Views on Vision4Press platform.
Data correspond to usage on the plateform after 2015. The current usage metrics is available 48-96 hours after online publication and is updated daily on week days.
Initial download of the metrics may take a while.