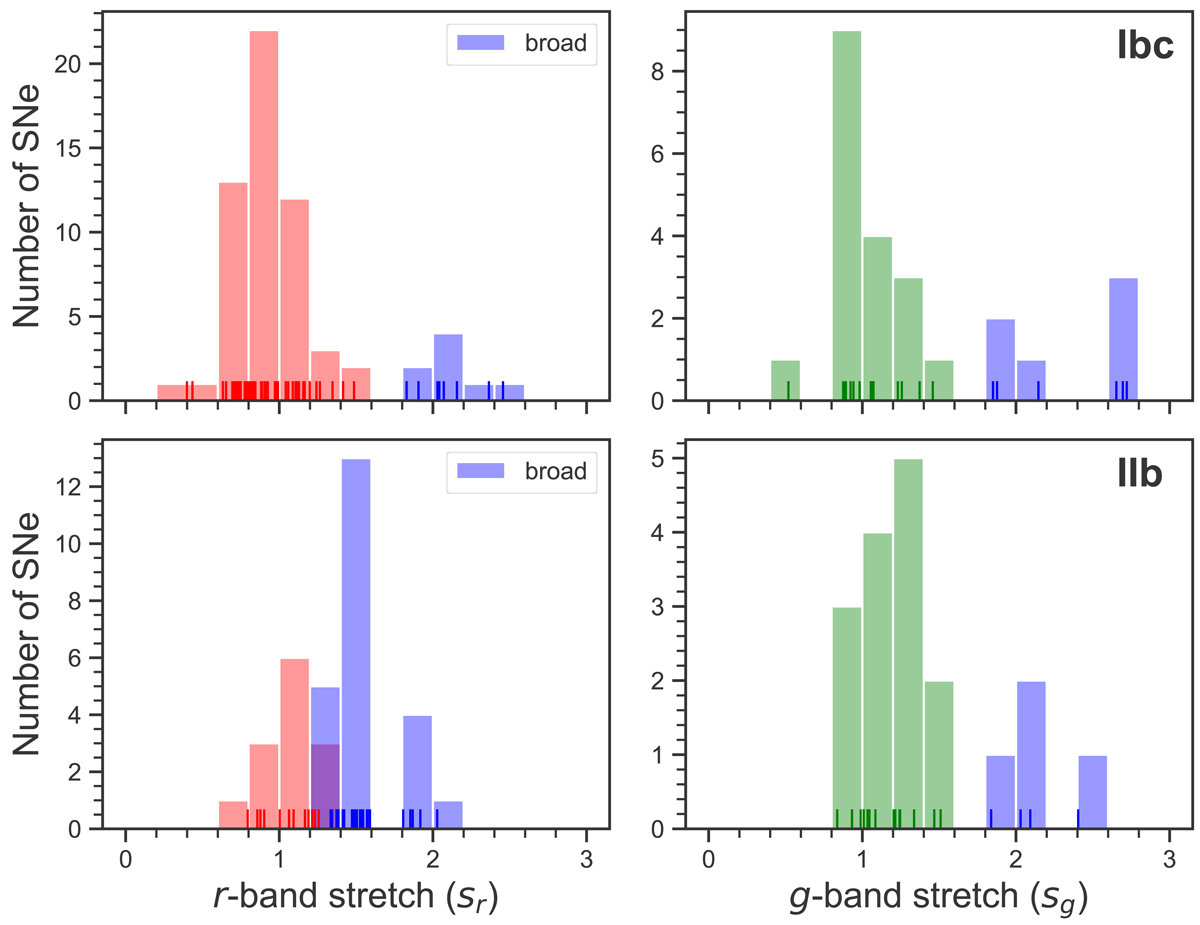
Fig. A.3.
Download original image
Histogram of distribution of stretch values plotted after running k-means clustering algorithm on the one-dimensional stretch parameter dataset. The SNe put in to a second cluster by the algorithm have been plotted in blue, and labeled as broad. The ordinary (nonbroad) SNe in each band have been plotted with the respective color of that band (r band left and g band to the right). The histogram was not normalized so the counts represent the number of SNe in each bin. Top: Type Ibc SNe, Bottom: Type IIb SNe.
Current usage metrics show cumulative count of Article Views (full-text article views including HTML views, PDF and ePub downloads, according to the available data) and Abstracts Views on Vision4Press platform.
Data correspond to usage on the plateform after 2015. The current usage metrics is available 48-96 hours after online publication and is updated daily on week days.
Initial download of the metrics may take a while.