Fig. 5

Download original image
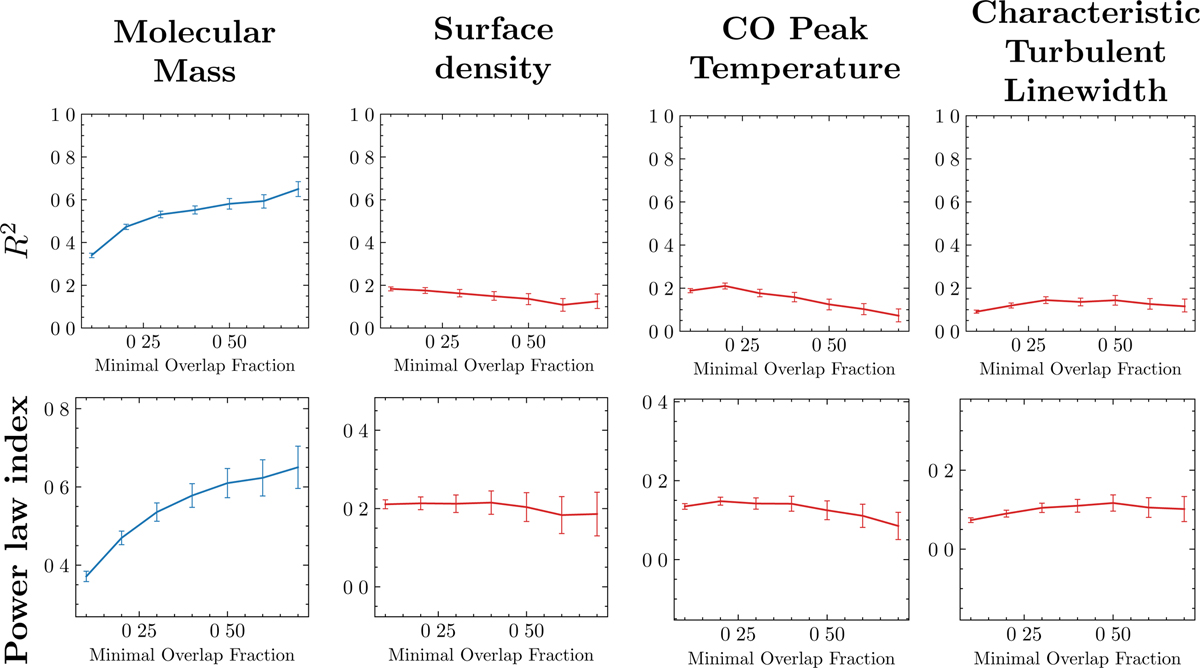
R2 (top) and power-law index (bottom) of the fits of various GMC properties (as a function of the Hα luminosity of the matched H II region) against the MOP. The fitted GMC properties are, from left to right: the molecular mass, the peak temperature, the surface density, and the characteristic turbulent linewidth. Blue (respectively red) lines show an increase (respectively decrease) of the R2 coefficient with the MOP. The uncertainty intervals are computed using a standard bootstrap method.
Current usage metrics show cumulative count of Article Views (full-text article views including HTML views, PDF and ePub downloads, according to the available data) and Abstracts Views on Vision4Press platform.
Data correspond to usage on the plateform after 2015. The current usage metrics is available 48-96 hours after online publication and is updated daily on week days.
Initial download of the metrics may take a while.


