Fig. 2

Download original image
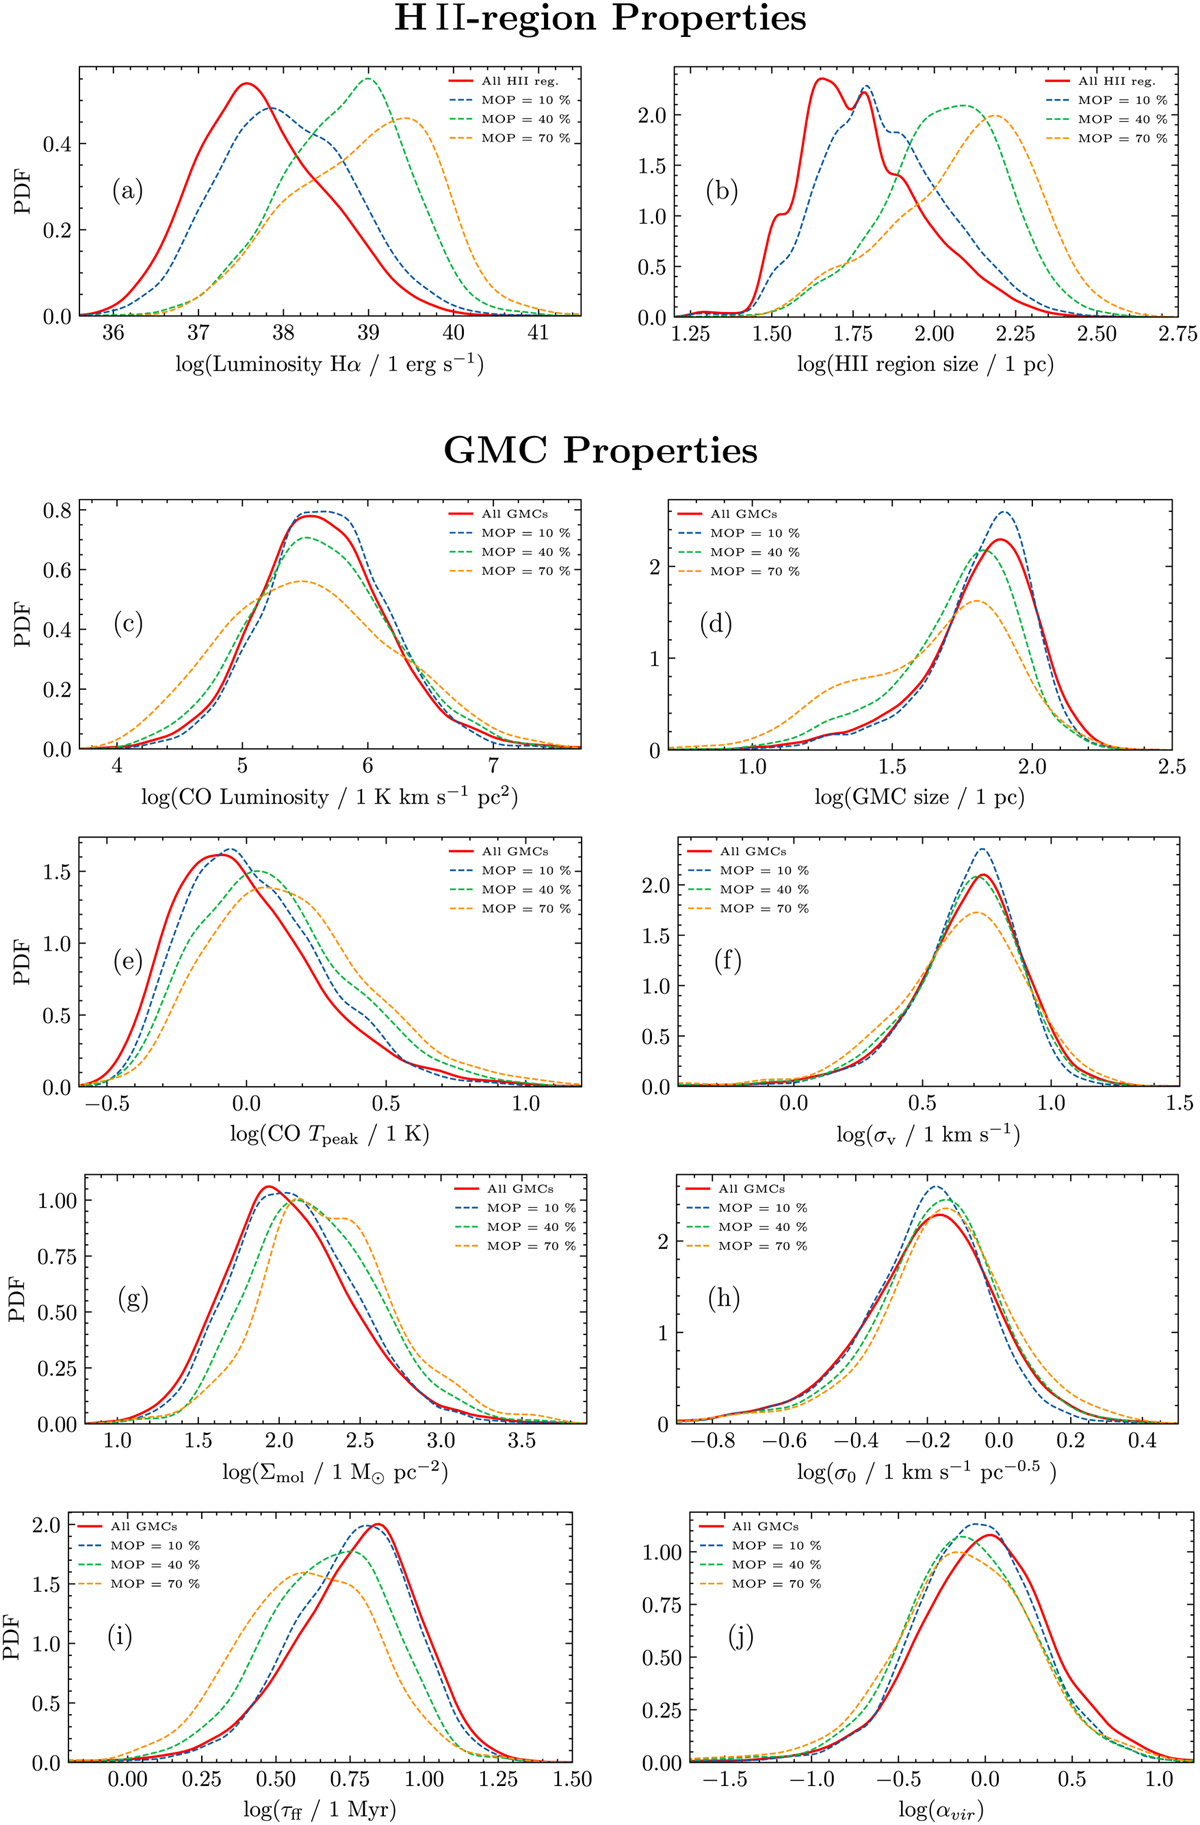
PDFs of key physical properties of H II regions and of GMCs. Top, from left to right: Extinction-corrected Hα luminosity and size. Bottom, from top left to bottom right: CO luminosity, size, peak temperature, velocity dispersion, surface density, characteristic turbulent linewidth, free-fall time, and virial parameter. The distribution for the full GMC (H II region) population is shown in red, while the matched GMCs–H II regions adopting a MOP of 10, 40, and 70% are shown in blue, green, and gold, respectively.
Current usage metrics show cumulative count of Article Views (full-text article views including HTML views, PDF and ePub downloads, according to the available data) and Abstracts Views on Vision4Press platform.
Data correspond to usage on the plateform after 2015. The current usage metrics is available 48-96 hours after online publication and is updated daily on week days.
Initial download of the metrics may take a while.


