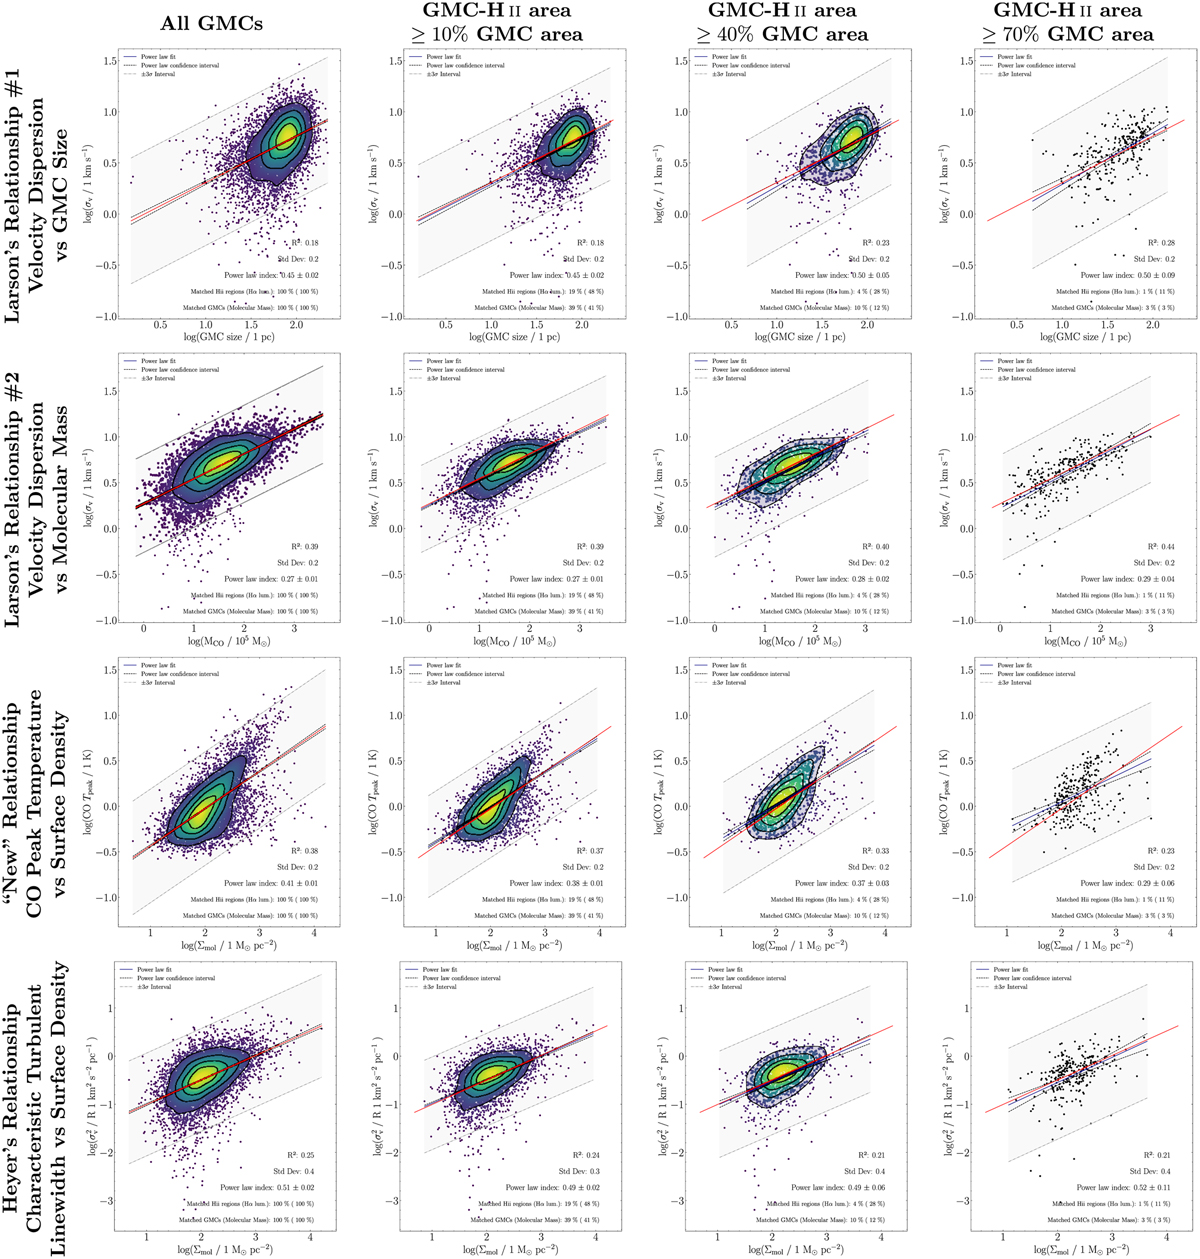
Fig. E.1

Download original image
Evolution of the Larson, Heyer, and peak temperature versus surface density correlations for all the GMCs in the sample (first columns) and three different minimum overlap percentage of the H II-GMC pairs: 10% for the second column, 40% for the third one, and 70% for the fourth one. The solid and dotted black lines show the power-law fits and their uncertainty, respectively. The dashed lines show the ±3σ levels from the fitted line. The power-law parameters are displayed on the bottom-right corner of each panel. The red solid lines show the power-law fit for the parent population (all GMCs in the sample).
Current usage metrics show cumulative count of Article Views (full-text article views including HTML views, PDF and ePub downloads, according to the available data) and Abstracts Views on Vision4Press platform.
Data correspond to usage on the plateform after 2015. The current usage metrics is available 48-96 hours after online publication and is updated daily on week days.
Initial download of the metrics may take a while.


