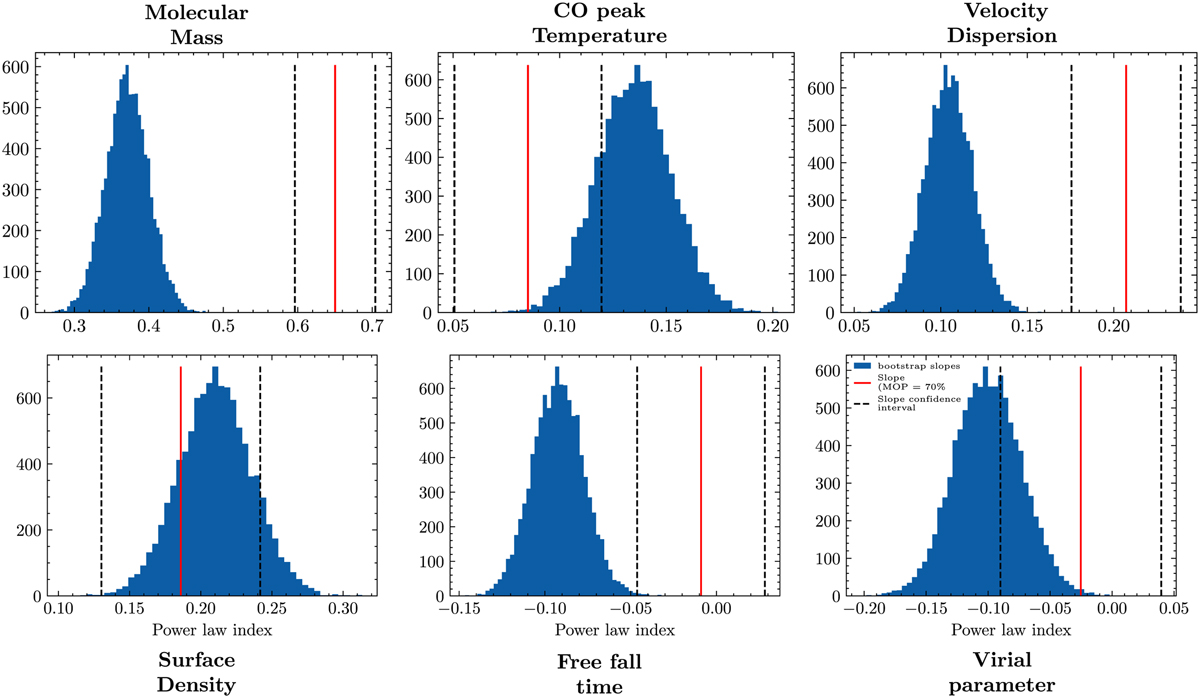
Fig. C.3

Download original image
Bootstrap tests of the significance of the power-law index change with the MOP. The red line represents the power-law index obtained after matching with a 70% overlap, and the dashed lines its confidence interval. The blue distribution represents the power-law indices obtained after randomly sampling N pairs from the parent distribution (10% overlap), where N is the size of the 70% minimal overlap distribution. This random sampling has been performed 10000 times in order to obtain the distribution. This figure shows that the change in power-law index with the MOP cannot arise from a random sampling of the parent population, except for the surface density.
Current usage metrics show cumulative count of Article Views (full-text article views including HTML views, PDF and ePub downloads, according to the available data) and Abstracts Views on Vision4Press platform.
Data correspond to usage on the plateform after 2015. The current usage metrics is available 48-96 hours after online publication and is updated daily on week days.
Initial download of the metrics may take a while.


