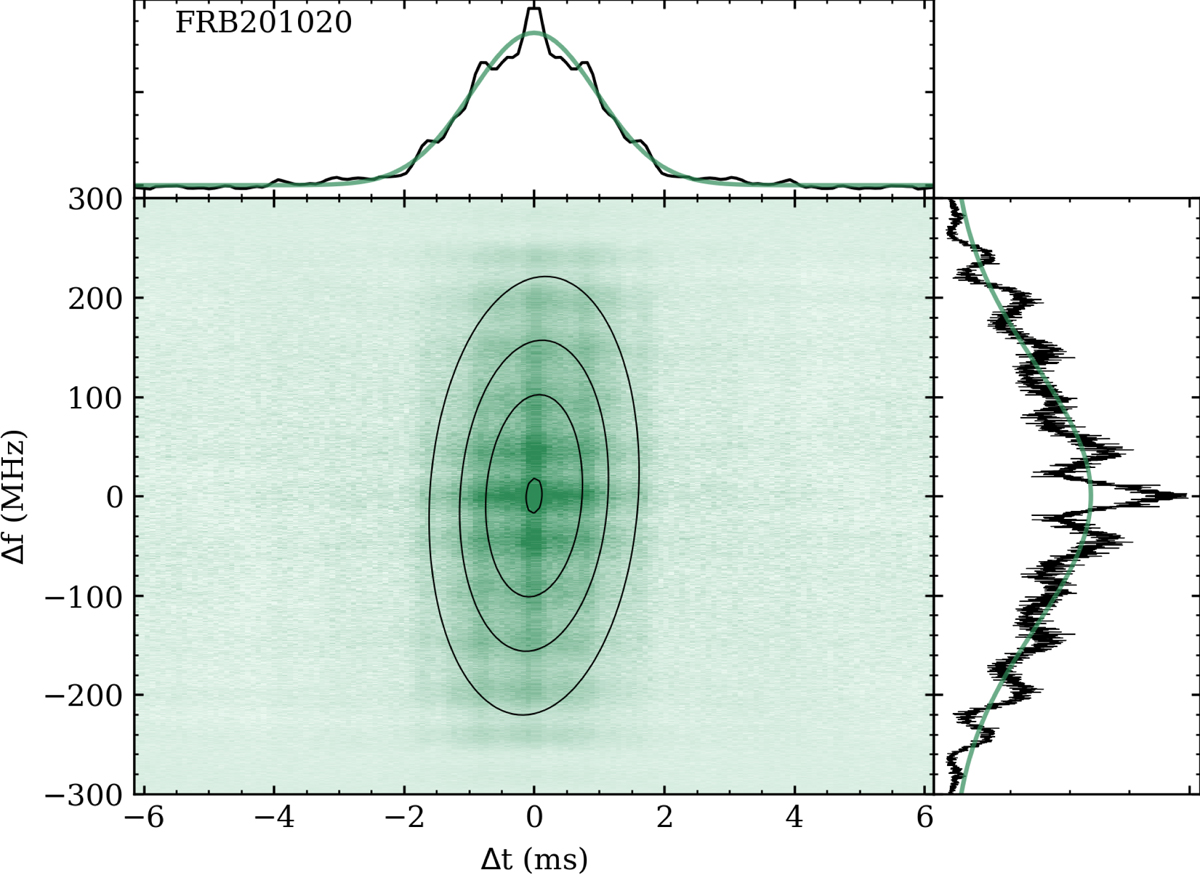
Fig. B.1.
Download original image
Two-dimensional ACFs of FRB 20201020A. The lower left panel shows the 2D ACF in green, and the 2D Gaussian fit as black elliptical contours. The top panel shows the frequency-averaged temporal ACF in black and the Gaussian fit in green. The left panels show the time-averaged ACF in frequency in black and the Gaussian fit in green.
Current usage metrics show cumulative count of Article Views (full-text article views including HTML views, PDF and ePub downloads, according to the available data) and Abstracts Views on Vision4Press platform.
Data correspond to usage on the plateform after 2015. The current usage metrics is available 48-96 hours after online publication and is updated daily on week days.
Initial download of the metrics may take a while.