Fig. A.1.
Download original image
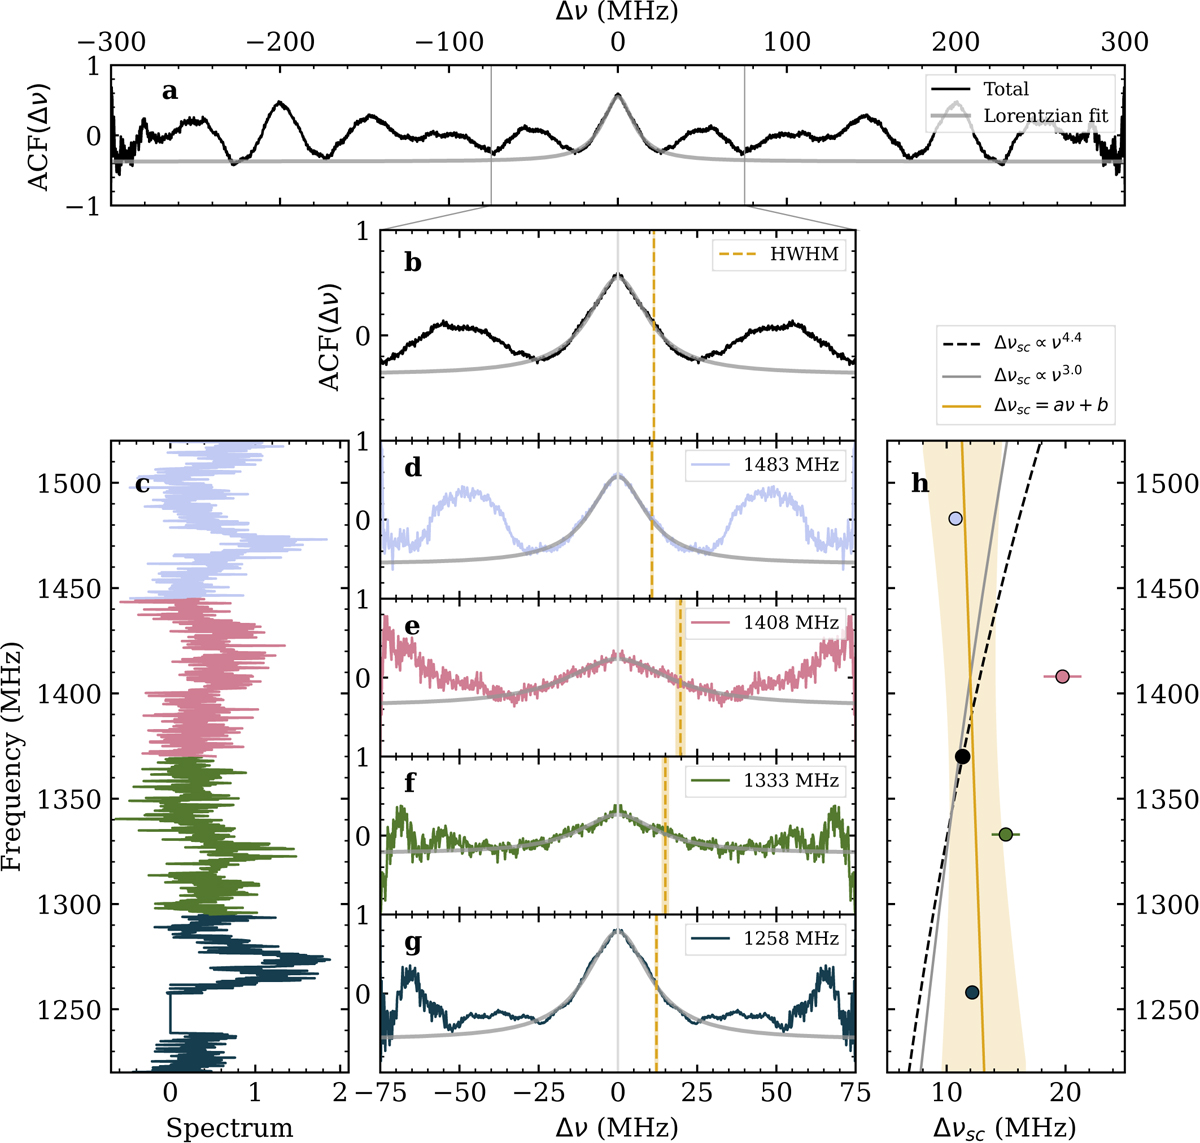
Scintillation analysis of FRB 20201020A. Panel (a) shows the ACF of the full spectrum of the FRB in black, with a grey solid line showing the fit of the central peak to a Lorentzian function. Panel (b) shows a zoomed-in version of the central 75 MHz of the ACF, with a yellow dashed line with shaded regions indicating the HWHM of the fitted Lorentzian. Panel (c) shows the spectrum of the FRB, with four different colours indicating the four sub-bands it was divided into. Panels (d), (e), (f), and (g) show the ACF of each of the four subbands of the spectrum, with colours matching the division of the spectrum, and the grey lines showing the fit of the central peak to a Lorentzian. The yellow dashed line with shaded contours marks the position of the HWHM. Finally, panel (h) gives the HWHM of each sub-band as a function of frequency. The coloured markers match the colours of the subbands, and the black marker indicates the HWHM over the whole spectrum. The black dashed line indicates the expected evolution with frequency for a power-law index α = 4.4, as expected from scintillation in the ISM. The grey line marks the fit of the four sub-band HWHMs to a power-law function, and the yellow line marks its fit to a linear function.
Current usage metrics show cumulative count of Article Views (full-text article views including HTML views, PDF and ePub downloads, according to the available data) and Abstracts Views on Vision4Press platform.
Data correspond to usage on the plateform after 2015. The current usage metrics is available 48-96 hours after online publication and is updated daily on week days.
Initial download of the metrics may take a while.