Fig. 5.
Download original image
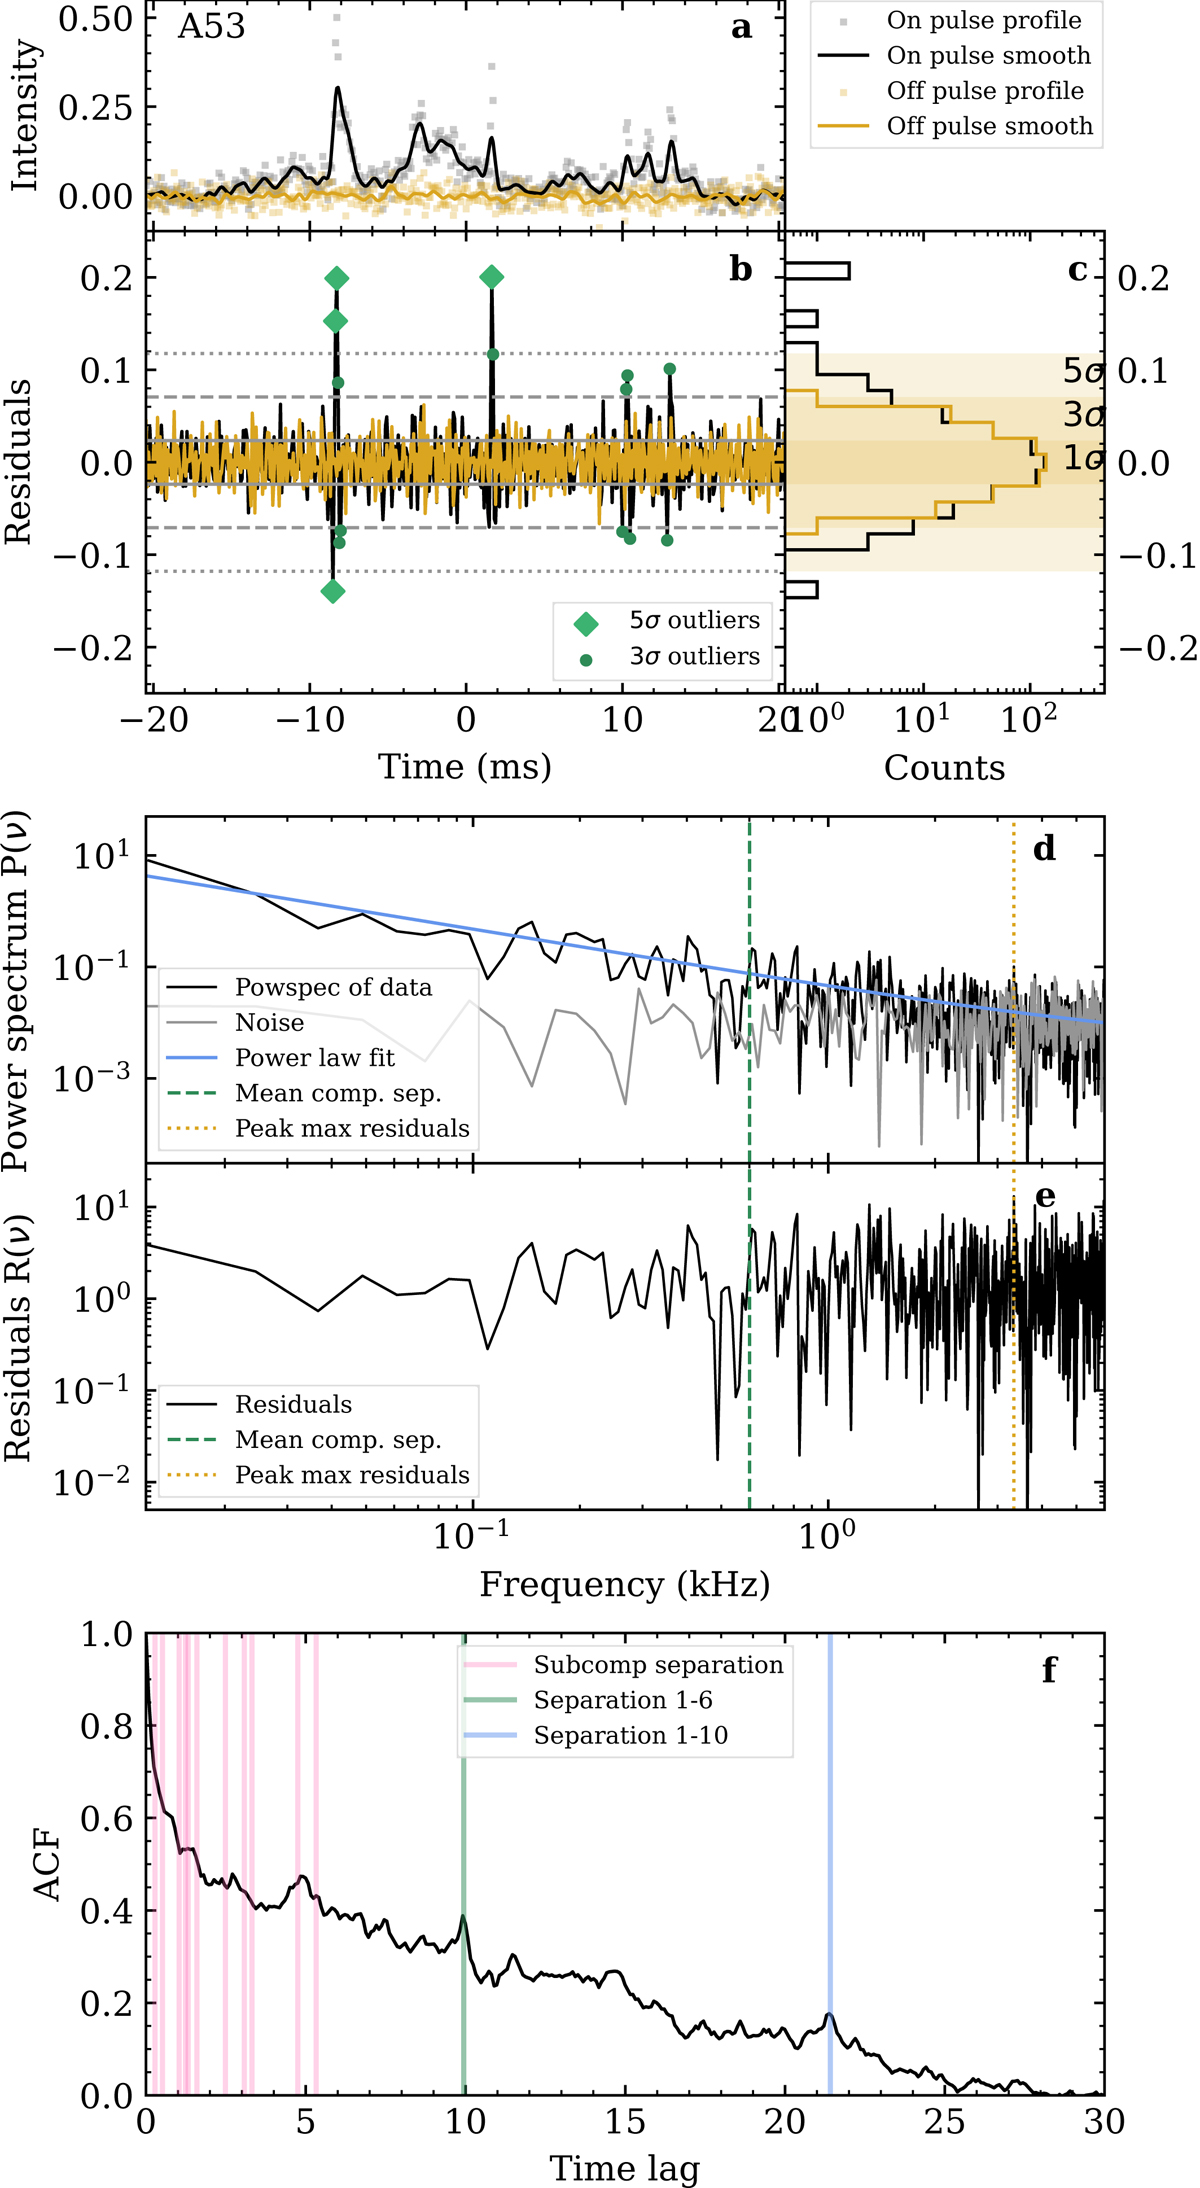
Timing analysis of burst A53 from FRB 20180916B. Panel (a) shows the pulse profile of A53 as grey dots at 82 μs time resolution, and the smoothed profile as a black solid line. The yellow dots and solid line show the same for the off-burst signal. Panel (b) shows the residuals of the on- and off-burst signal as black and yellow lines, respectively. Green diamonds and dots show respectively the 5σ and 3σ outliers of the on-burst residuals. Panel (c) shows the distribution of the on-burst residuals in black and off-burst residuals in yellow. The yellow shaded regions, from dark to light, indicate the 1σ, 2σ, and 3σ contours of the off-pulse distribution fitted to a Gaussian. Panel (d) shows the power spectrum of A53 in black fitted to a power-law function shown in blue. The green dashed and yellow dotted lines mark the position of the mean component separation and the maximum of the residuals, respectively. Panel (e) shows the power spectrum residuals R(ν). Panel (f) presents the ACF of the light curve of A53 as a solid black line. The pink vertical lines indicate the separation between consecutive components, the green line the separation between the two brightest components, and the blue line the separation between the first and third brightest components.
Current usage metrics show cumulative count of Article Views (full-text article views including HTML views, PDF and ePub downloads, according to the available data) and Abstracts Views on Vision4Press platform.
Data correspond to usage on the plateform after 2015. The current usage metrics is available 48-96 hours after online publication and is updated daily on week days.
Initial download of the metrics may take a while.