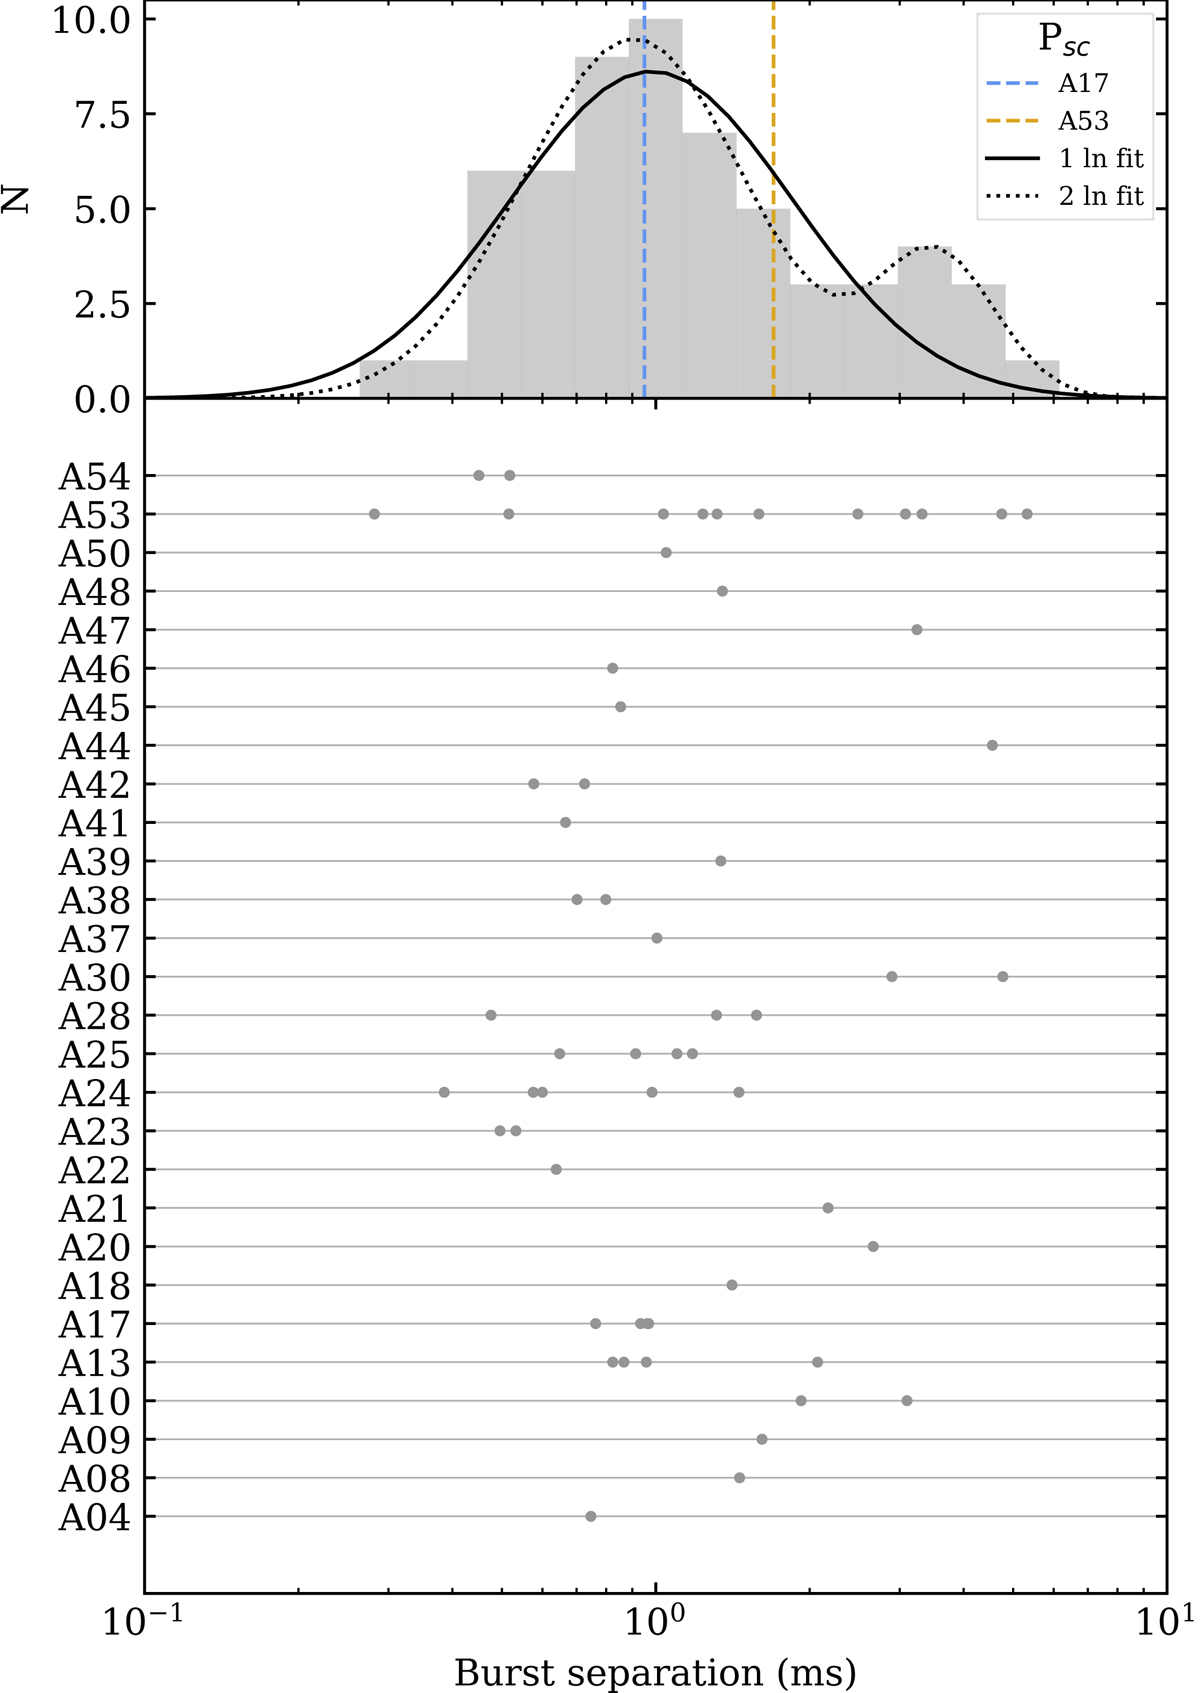
Fig. 4.
Download original image
Subcomponent separation of FRB 20180916B multi-component bursts presented in Pastor-Marazuela et al. (2021). The top panel shows a histogram of the burst separation between discernible subcomponents in multi-component bursts. The mean A17 and A53 separations are shown as vertical dashed blue and yellow lines, respectively. The fit to a single lognormal and a double lognormal distribution are shown as solid and dotted black lines, respectively. The bottom panel shows the burst separations in each burst of the sample.
Current usage metrics show cumulative count of Article Views (full-text article views including HTML views, PDF and ePub downloads, according to the available data) and Abstracts Views on Vision4Press platform.
Data correspond to usage on the plateform after 2015. The current usage metrics is available 48-96 hours after online publication and is updated daily on week days.
Initial download of the metrics may take a while.