Fig. 3.
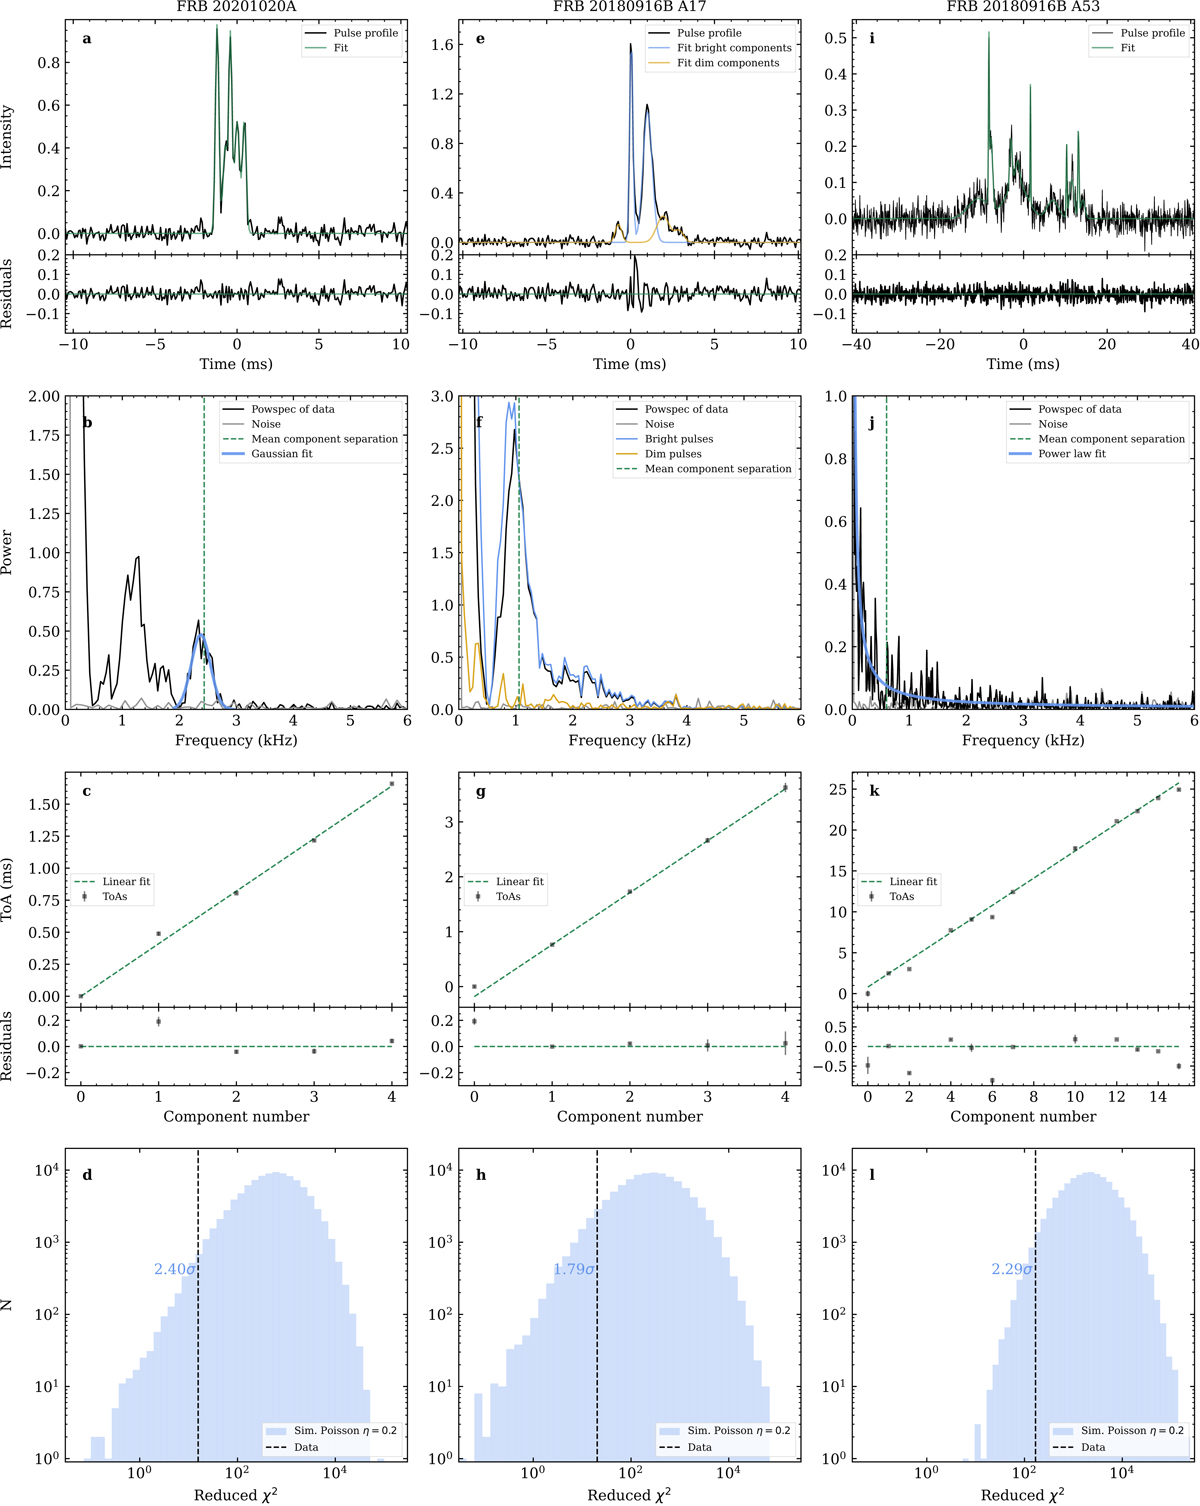
Download original image
Timing analysis of FRB 20201020A (left column), A17 (central column), and A53 (right column). The top of panels (a), (e), and (i) shows the pulse profile of each burst (black) and the fitted multi-component Gaussians in green for FRB 20201020A and A53; for A17 the bright components are shown in blue and the dim components in yellow. The bottom of panels (a), (e), and (i) shows the residuals of the multi-component Gaussian fit of each pulse profile. Panels (b), (f), and (j) show the power spectra of each pulse profile in black. In (b), the vertical dashed line indicates the average separation of the FRB 20201020A components, while the blue line shows the Gaussian fit to the 2.4 kHz component. In (f), the blue and yellow lines show respectively the power spectra of the bright and dim components. Panels (c), (g), and (k) show the ToAs of all subcomponents as a function of component number. In most cases, the error on the ToAs is smaller than the marker size. The dashed green lines in (c), (g), and (k) are linear fits to the ToAs, and the lower panels show their residuals normalised by the mean subcomponent separation Psc. Panels (d), (h), and (l) show histograms of the simulated rχ2 statistic using a shifted Poissonian subcomponent spacing distribution with η = 0.2 to compute the significance of the periodicity. The vertical lines correspond to the rχ2 of the linear fit to the data. The significance is indicated as blue text.
Current usage metrics show cumulative count of Article Views (full-text article views including HTML views, PDF and ePub downloads, according to the available data) and Abstracts Views on Vision4Press platform.
Data correspond to usage on the plateform after 2015. The current usage metrics is available 48-96 hours after online publication and is updated daily on week days.
Initial download of the metrics may take a while.