Open Access
Fig. 2.
Download original image
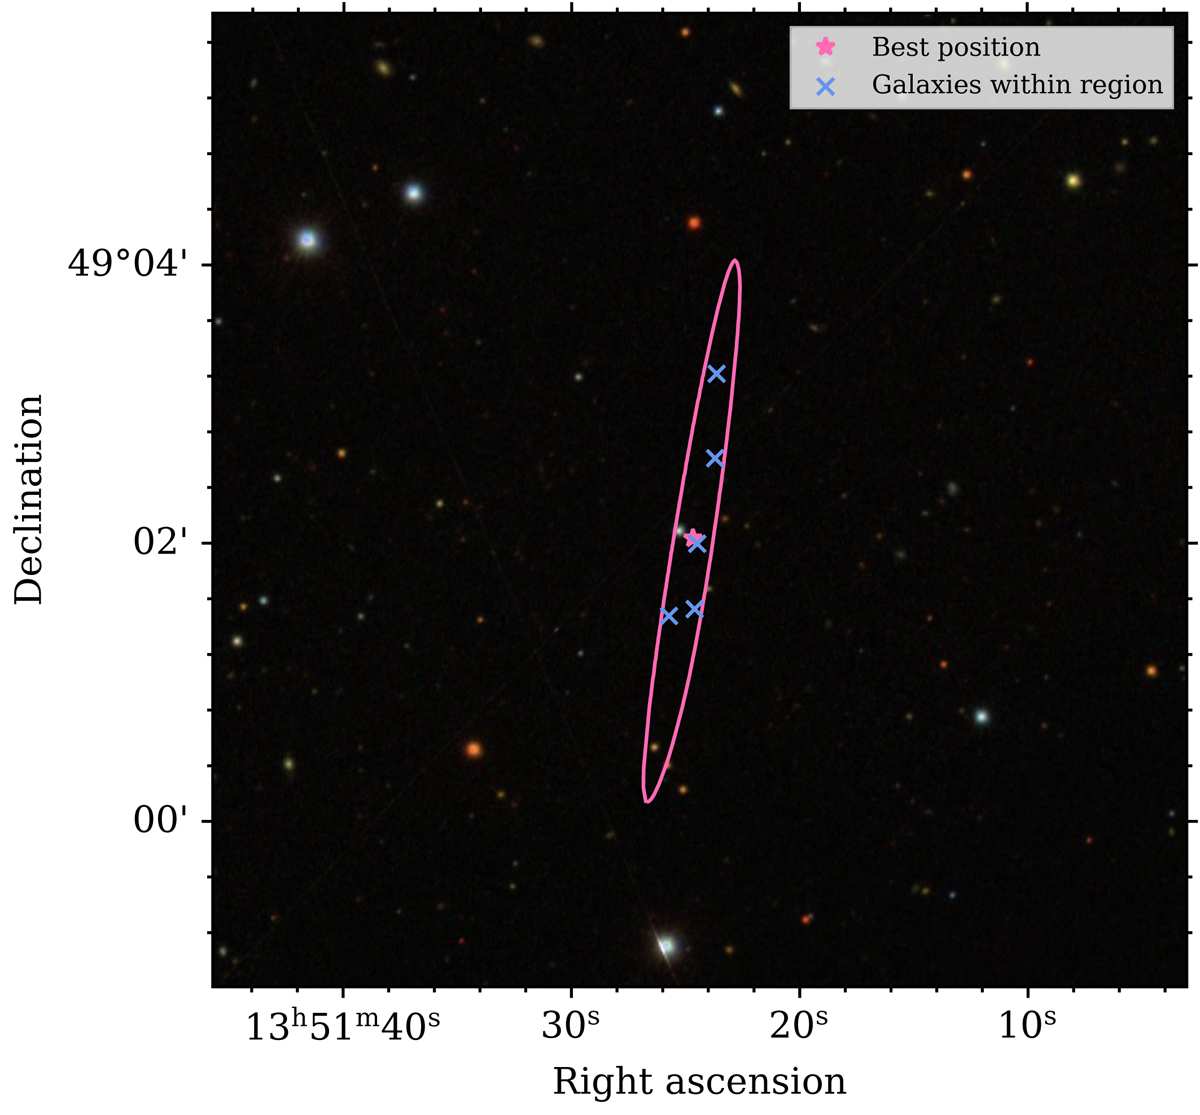
Localisation region of FRB 20201020A. The best position is indicated by a pink cross, and the 99% confidence interval contour is represented by the pink ellipse. Galaxies from the NED database within the error region are marked as blue crosses. The background is a composite colour image from SDSS (Blanton 2017).
Current usage metrics show cumulative count of Article Views (full-text article views including HTML views, PDF and ePub downloads, according to the available data) and Abstracts Views on Vision4Press platform.
Data correspond to usage on the plateform after 2015. The current usage metrics is available 48-96 hours after online publication and is updated daily on week days.
Initial download of the metrics may take a while.