Fig. D.1.
Download original image
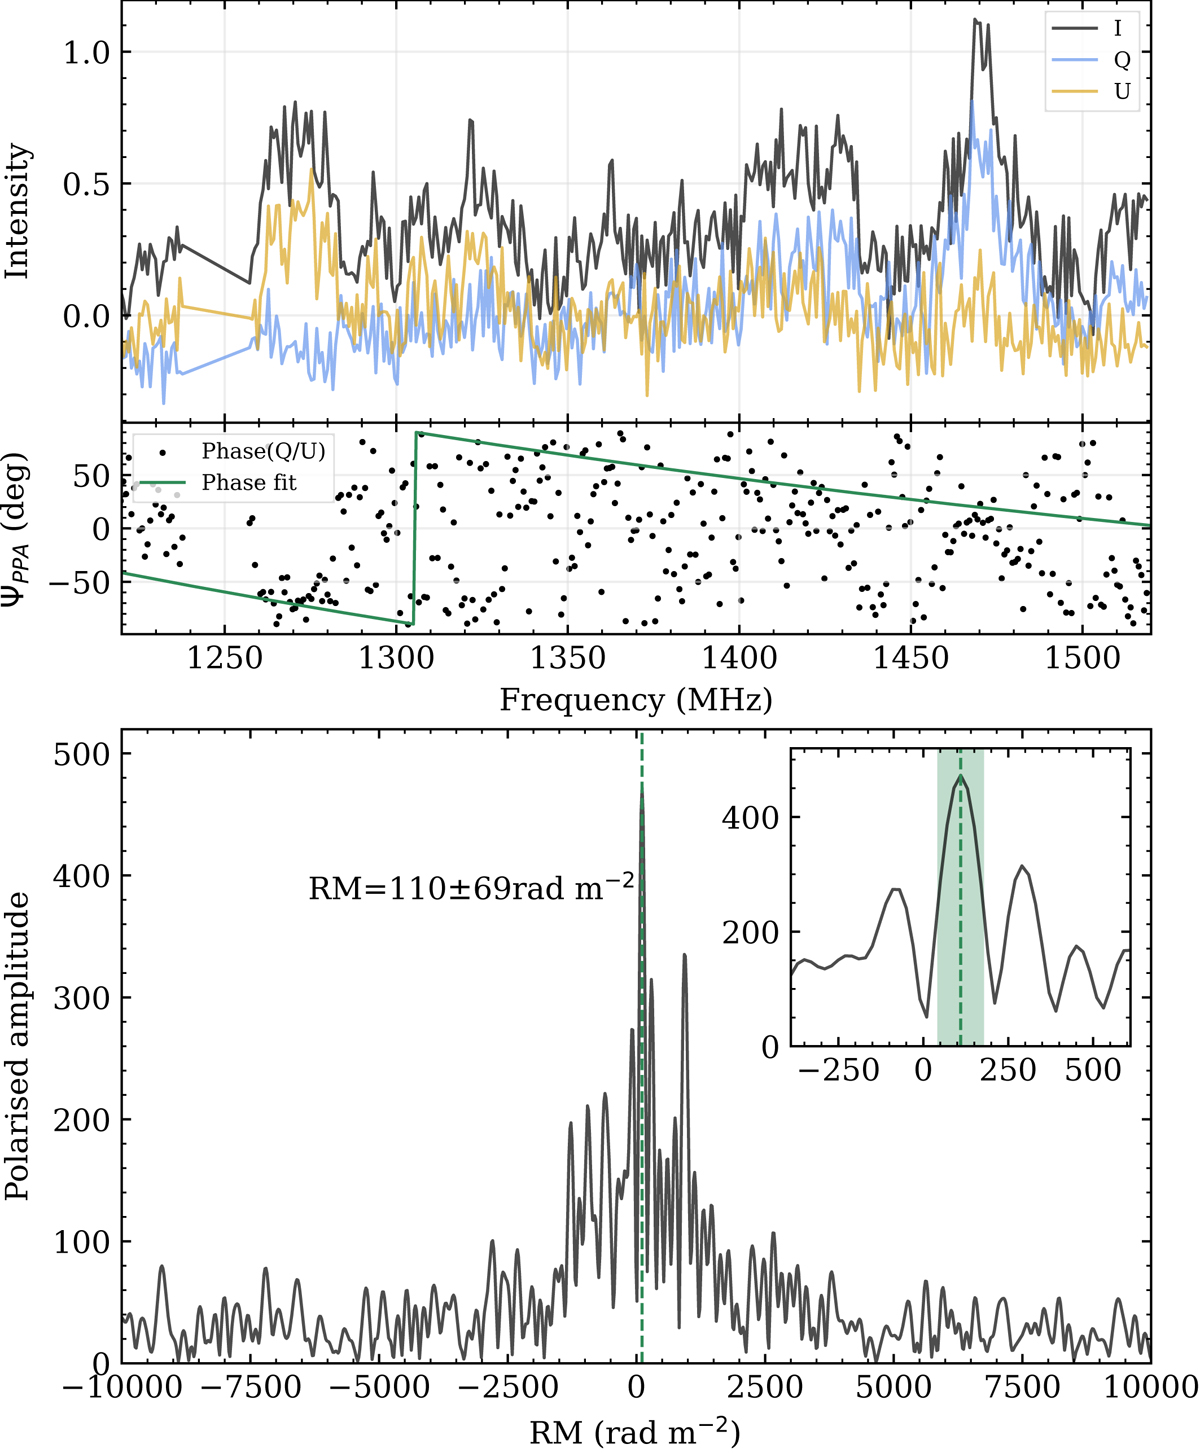
Measured polarisation properties of FRB 20201020A. The top panel shows the Stokes parameters I (black), Q (blue) and U (yellow) as a function of frequency, calibrated by assuming Stokes V to be zero. The second panel shows the measured phase between Q and U (black dots) and its fit in green. The bottom panel shows the RM-synthesis solution, with the polarised amplitude as a function of RM. The dashed green line marks the position of the maximum, at RM=+110 ± 69 pc cm−3. The inset shows the same, but zoomed in at the central peak of the polarised amplitude.
Current usage metrics show cumulative count of Article Views (full-text article views including HTML views, PDF and ePub downloads, according to the available data) and Abstracts Views on Vision4Press platform.
Data correspond to usage on the plateform after 2015. The current usage metrics is available 48-96 hours after online publication and is updated daily on week days.
Initial download of the metrics may take a while.