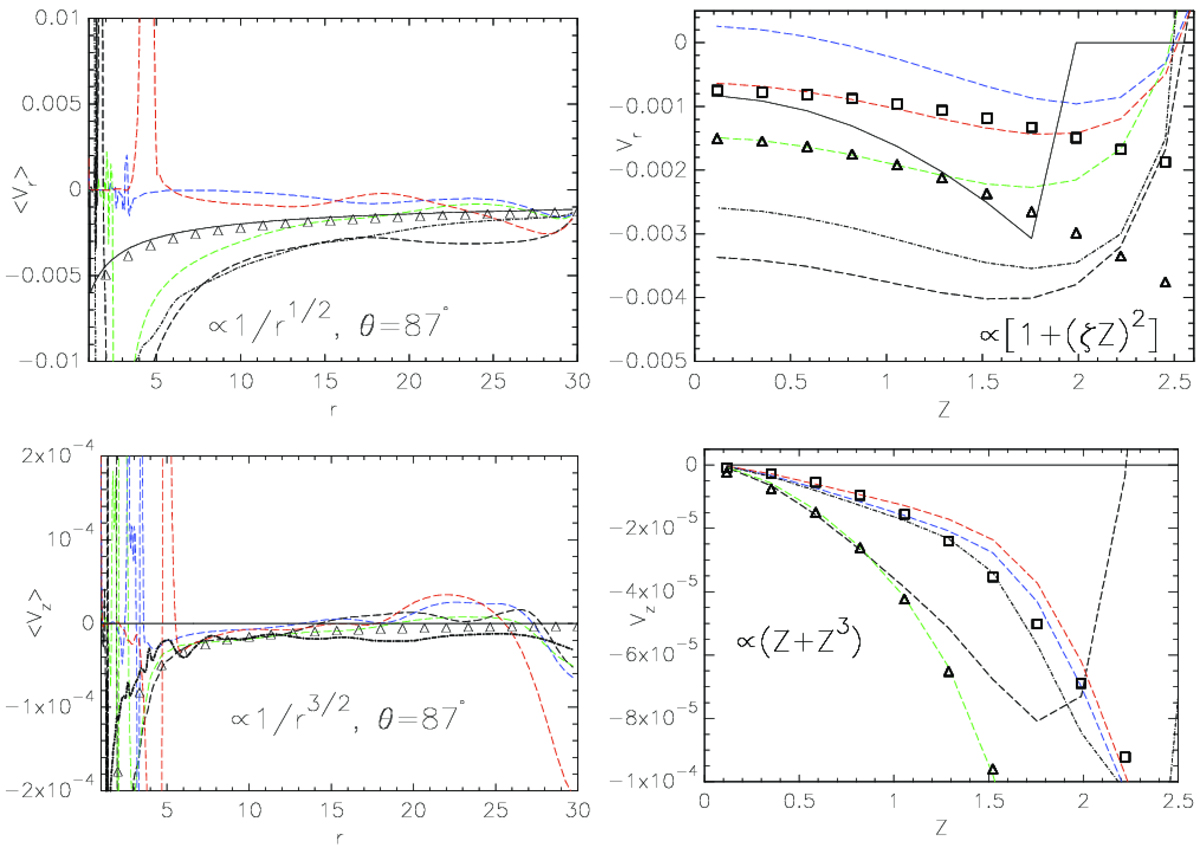
Fig. 6.
Download original image
Comparison of the r and z velocity components in the initial set-up (thin solid line) with the quasi-stationary solutions in the numerical simulations in the HD (dot-dashed line) and the MHD (long-dashed line) cases, with Ω = 0.2Ωms. The meaning of the lines is the same as in Fig. 3. Left panels: values averaged over 10 stellar rotations, to smooth out the oscillations. Right panels: values at r = 15R⋆. In the z-direction, an additional match is shown with squares in the cases with larger magnetic field. It has the same (analytically derived) functional dependence as shown with triangles for the smaller magnetic field, only the proportionality coefficient is different.
Current usage metrics show cumulative count of Article Views (full-text article views including HTML views, PDF and ePub downloads, according to the available data) and Abstracts Views on Vision4Press platform.
Data correspond to usage on the plateform after 2015. The current usage metrics is available 48-96 hours after online publication and is updated daily on week days.
Initial download of the metrics may take a while.