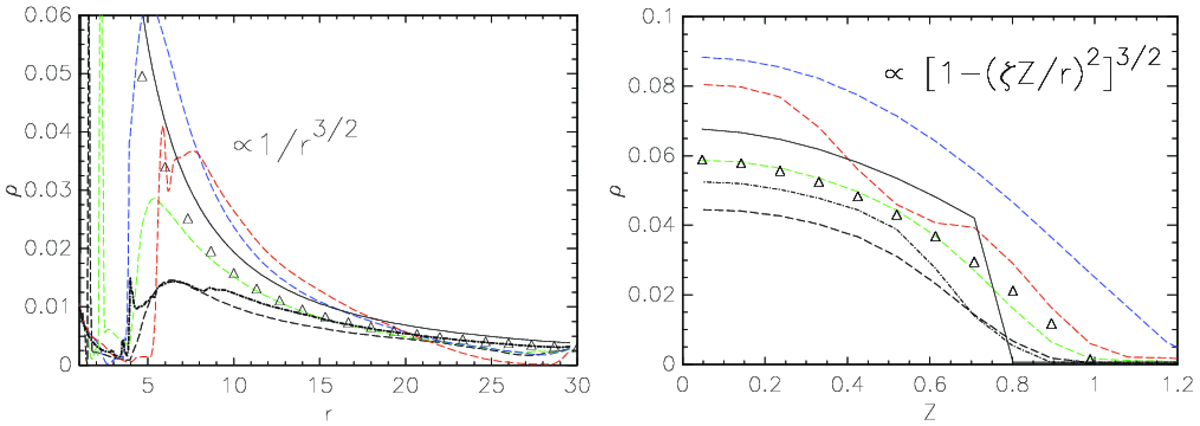
Fig. 5.
Download original image
Comparison of the matter density in the initial set-up (solid line) with the analytic profiles (triangles) and the quasi-stationary solutions in numerical simulations in the HD (dot-dashed line) and the MHD cases closer to the disk surface and the star. The solution is more noisy than in the previous figure. Left panel: density variation along the disk surface at θ = 83°. Right panel: density variation along a vertical line at r = 6R⋆; here, the trend of density increasing with the magnetic field is not maintained for the strongest fields, the red line being lower than the blue line. The meaning of the lines is the same as in Fig. 3.
Current usage metrics show cumulative count of Article Views (full-text article views including HTML views, PDF and ePub downloads, according to the available data) and Abstracts Views on Vision4Press platform.
Data correspond to usage on the plateform after 2015. The current usage metrics is available 48-96 hours after online publication and is updated daily on week days.
Initial download of the metrics may take a while.