Fig. 3.

Download original image
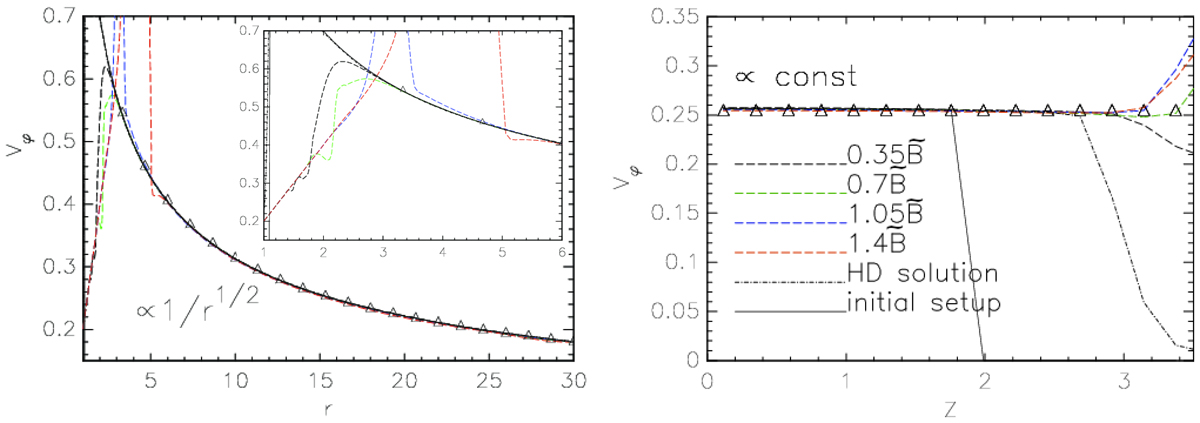
Azimuthal velocity of thin disks from our simulations with Ω = 0.2 Ωms. As expected from theory, it closely follows the Keplerian curve and is uniform on cylinders (with corrections of order z2/r2). The disk-corona interface is at z ≈ 2. This and later figures exhibit values in the initial set-up (thin black solid line), and the quasi-stationary solutions in the numerical simulations in the HD (dot-dashed black line), and the MHD (long-dashed line) cases. Black, green, blue, and red colors correspond to stellar magnetic field strength (0.35, 0.7, 1.05, 1.4) ![]() , respectively (cf. the final paragraph of Appendix B). The closest match (in normalization) of the analytic profile to the
, respectively (cf. the final paragraph of Appendix B). The closest match (in normalization) of the analytic profile to the ![]() case is depicted with triangle symbols. Left panel: radial dependence along the midplane, just above θ = 90°. Insert shows a zoom into the vicinity of the stellar surface, where the inner boundary condition affects the solution so that it is different than in the purely HD case. Right panel: the profiles along a vertical line at r = 15R⋆. The thin black solid line, sloping down at z ≈ 2 in the right panel, indicates vφ in the initial set-up. The legend describes the line styles also for the following three figures.
case is depicted with triangle symbols. Left panel: radial dependence along the midplane, just above θ = 90°. Insert shows a zoom into the vicinity of the stellar surface, where the inner boundary condition affects the solution so that it is different than in the purely HD case. Right panel: the profiles along a vertical line at r = 15R⋆. The thin black solid line, sloping down at z ≈ 2 in the right panel, indicates vφ in the initial set-up. The legend describes the line styles also for the following three figures.
Current usage metrics show cumulative count of Article Views (full-text article views including HTML views, PDF and ePub downloads, according to the available data) and Abstracts Views on Vision4Press platform.
Data correspond to usage on the plateform after 2015. The current usage metrics is available 48-96 hours after online publication and is updated daily on week days.
Initial download of the metrics may take a while.


