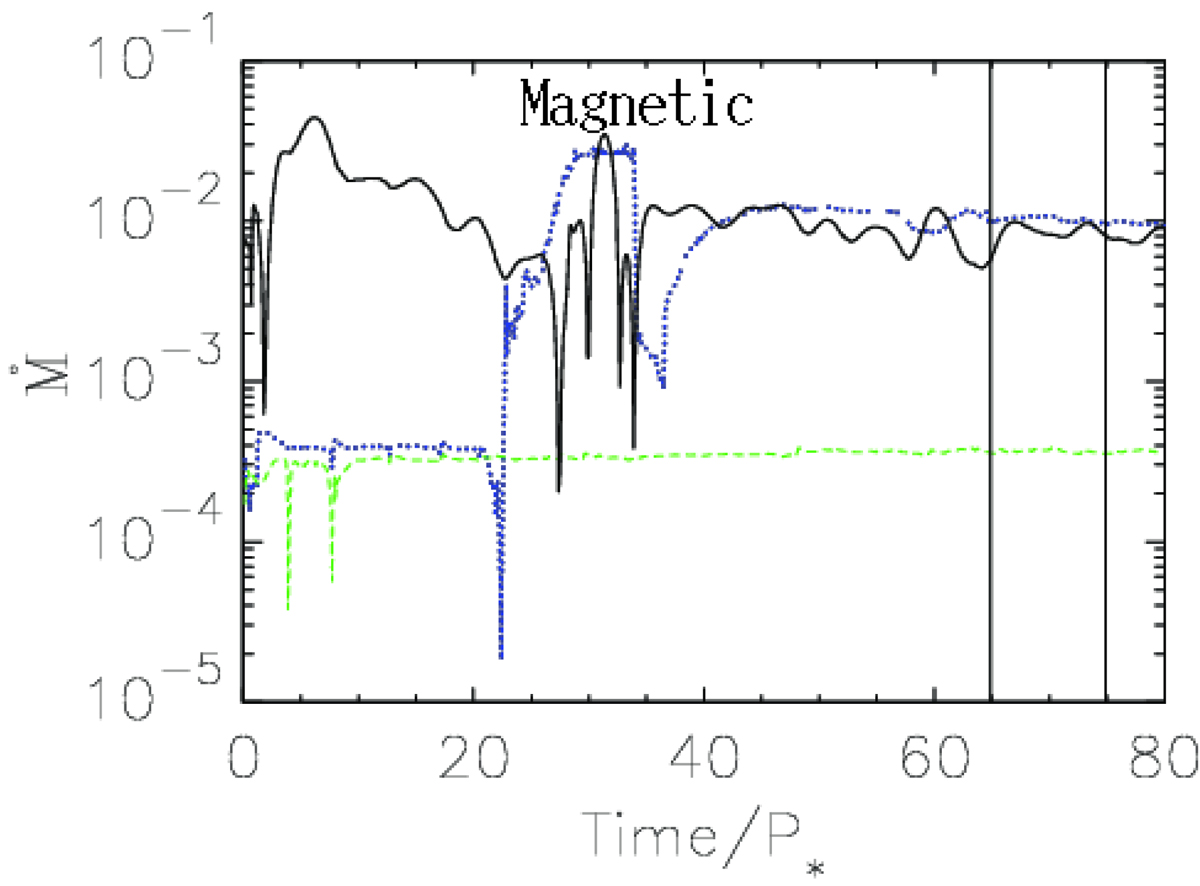
Fig. B.3.
Download original image
Illustration of quasi-stationarity in our magnetic case solutions, in the same (code) units as in Fig. B.2. Shown is the mass flux in the various components of the flow through the disk at r = 15R⋆ (solid black line), onto the stellar surface (dotted blue line), and into the magnetospheric wind (dashed green line). Vertical thin lines mark the interval in which we take the average for quasi-stationary solution.
Current usage metrics show cumulative count of Article Views (full-text article views including HTML views, PDF and ePub downloads, according to the available data) and Abstracts Views on Vision4Press platform.
Data correspond to usage on the plateform after 2015. The current usage metrics is available 48-96 hours after online publication and is updated daily on week days.
Initial download of the metrics may take a while.