| Issue |
A&A
Volume 678, October 2023
Parker Solar Probe: Ushering a new frontier in space exploration
|
|
|---|---|---|
| Article Number | C3 | |
| Number of page(s) | 1 | |
| Section | The Sun and the Heliosphere | |
| DOI | https://doi.org/10.1051/0004-6361/202039510e | |
| Published online | 19 October 2023 | |
Periodicities in an active region correlated with Type III radio bursts observed by Parker Solar Probe (Corrigendum)
1
School of Physics and Astronomy, University of Minnesota,
116 Church St. SE,
Minneapolis, MN
55455 USA
e-mail: cattell@umn.edu
2
Space Sciences Laboratory, University of California,
Berkeley, Berkeley, CA
94709
USA
3
Department of Physics, University of California,
Berkeley, Berkeley, CA
94709 USA
Key words: Sun: radio radiation / Sun: corona / Sun: X-rays / gamma rays / Sun: oscillations / magnetic reconnection / errata / addenda
In the original paper, the time intervals for the Parker Solar Probe (PSP) radio data plotted in two figures, Fig. 4 (left-hand panels) and Fig. 6, were incorrect. The errors described herein do not change the conclusions of the original paper.
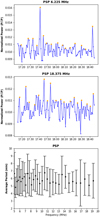
The light curves and periodicity analysis for the correct time interval for the the left-hand panels of Fig. 4 (original paper) are shown in Fig. 1. For the two radio frequencies plotted (6.225 MHz and 18.375 MHz), the periods found via the peak finder method are 5.6 ± [1.6] min and 5.1 ± [1.4] min. The fast Fourier transforms are peaked at 4.4 min and 4.1 min. These results are within the error bars of the periods in the original figure.
The periodicity analysis for an earlier time on April 9, 2019, is plotted in Fig. 2, which replaces Fig. 6 of the original paper. The periods are consistent with those in the original paper, providing evidence that these quasi-periodic variations in the Type III radio waves can persist for long times.
Acknowledgements.
The authors are very grateful to Theo Mahaffey. His careful and detailed examination of the code identified the error. He also implemented a new approach to verifying results.
© The Authors 2023
 Open Access article, published by EDP Sciences, under the terms of the Creative Commons Attribution License (https://creativecommons.org/licenses/by/4.0), which permits unrestricted use, distribution, and reproduction in any medium, provided the original work is properly cited.
This article is published in open access under the Subscribe to Open model. Subscribe to A&A to support open access publication.
All Figures
 |
Fig. 1 Periodicities in PSP/FIELDS High-Frequency-Radio (HFR) power. Top: 6.225 MHz; middle: 18.375 MHz interpolated normalized power, with orange dots indicating the identified peaks; bottom: periods identified for all frequencies >5 MHz. |
| In the text | |
 |
Fig. 2 Periodicities seen in PSP/FIELDS HFR radio data for an earlier interval with a higher data rate. |
| In the text | |
Current usage metrics show cumulative count of Article Views (full-text article views including HTML views, PDF and ePub downloads, according to the available data) and Abstracts Views on Vision4Press platform.
Data correspond to usage on the plateform after 2015. The current usage metrics is available 48-96 hours after online publication and is updated daily on week days.
Initial download of the metrics may take a while.


