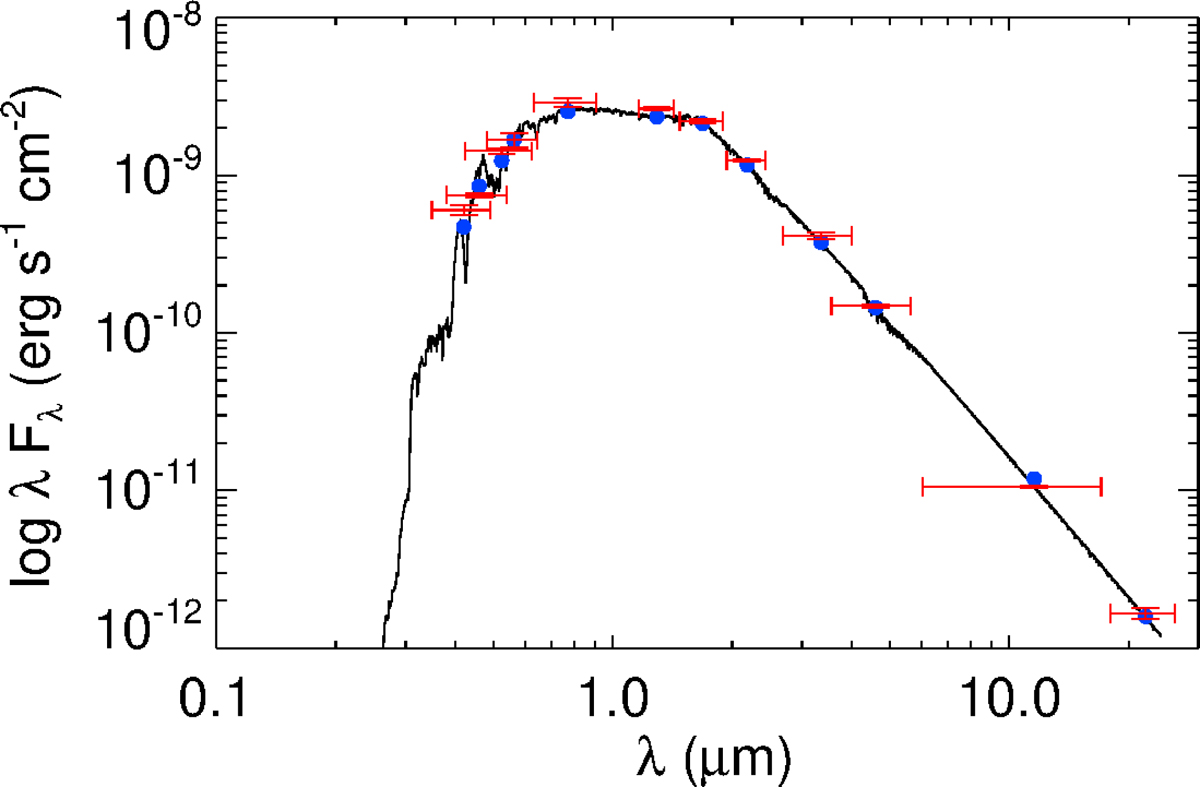
Fig. B.1.
Download original image
Spectral energy distribution of HIP 66074. Red markers depict the photometric measurements with vertical error bars corresponding to the reported measurement uncertainties from the catalogue photometry. Horizontal error bars depict the effective width of each pass-band. The black curve corresponds to the most likely stellar atmosphere model. Blue circles depict the model fluxes over each pass-band.
Current usage metrics show cumulative count of Article Views (full-text article views including HTML views, PDF and ePub downloads, according to the available data) and Abstracts Views on Vision4Press platform.
Data correspond to usage on the plateform after 2015. The current usage metrics is available 48-96 hours after online publication and is updated daily on week days.
Initial download of the metrics may take a while.