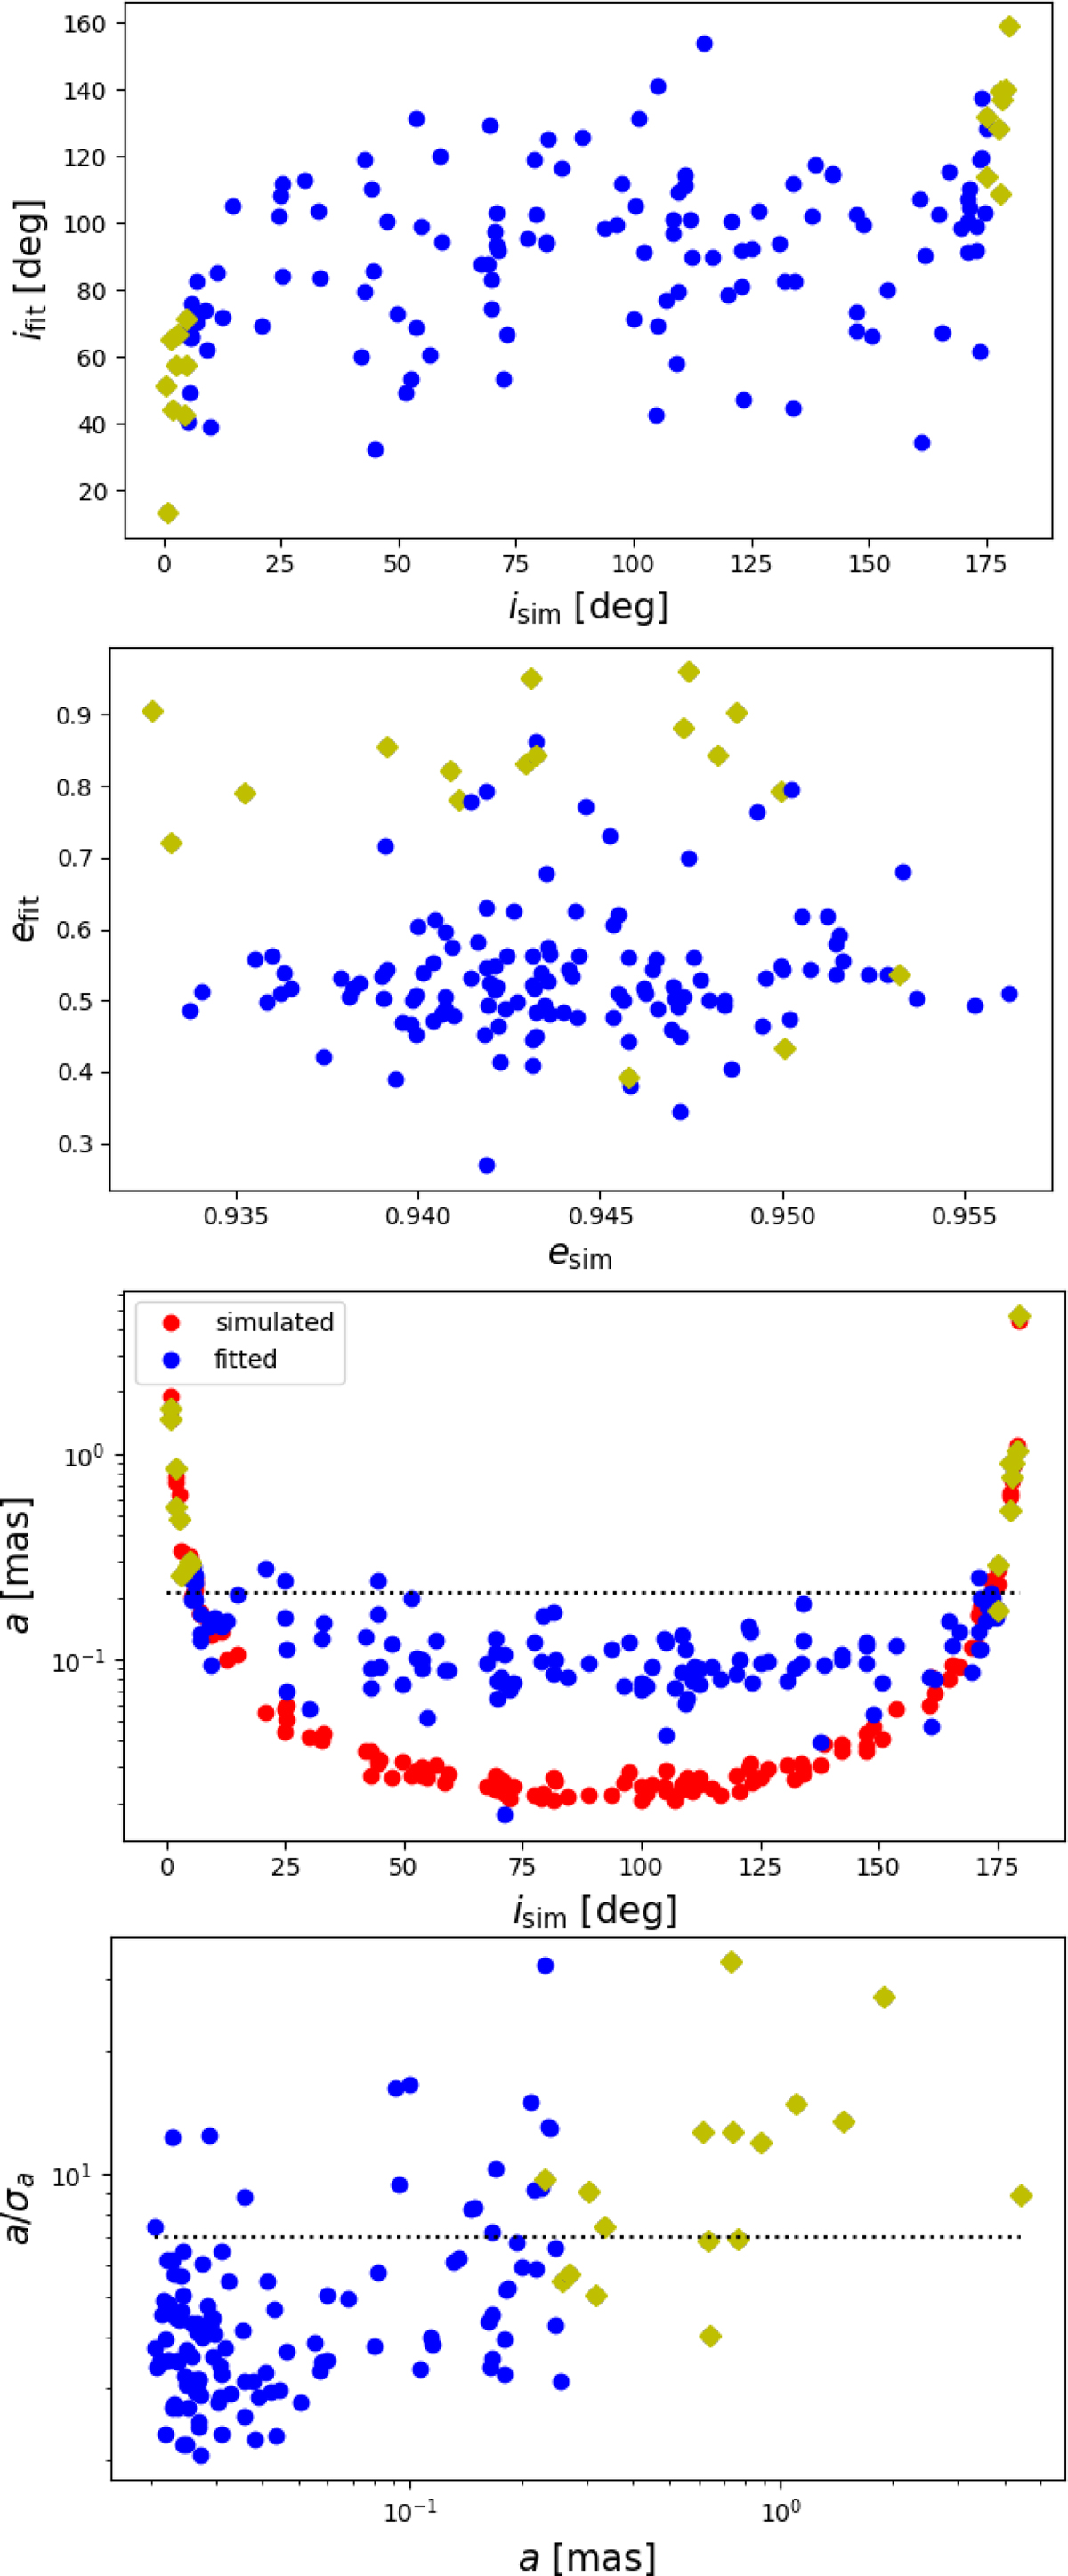
Fig. 2.
Download original image
Gaia astrometry simulations results. From top to bottom: (a) derived inclination vs. simulated value; (b) fitted eccentricity vs. simulated value; (c) derived (blue) and simulated (red) astrometric semi-major axis vs. injected orbital inclination; the black dotted line shows the semi-major axis of the Gaia solution, a0; (d) significance of the afit vs. simulated value; the black dotted line indicates the value obtained for the Gaia solution. In all panels yellow diamonds highlight orbits with inclination within 5° of an exactly face-on configuration.
Current usage metrics show cumulative count of Article Views (full-text article views including HTML views, PDF and ePub downloads, according to the available data) and Abstracts Views on Vision4Press platform.
Data correspond to usage on the plateform after 2015. The current usage metrics is available 48-96 hours after online publication and is updated daily on week days.
Initial download of the metrics may take a while.