Fig. C.1.
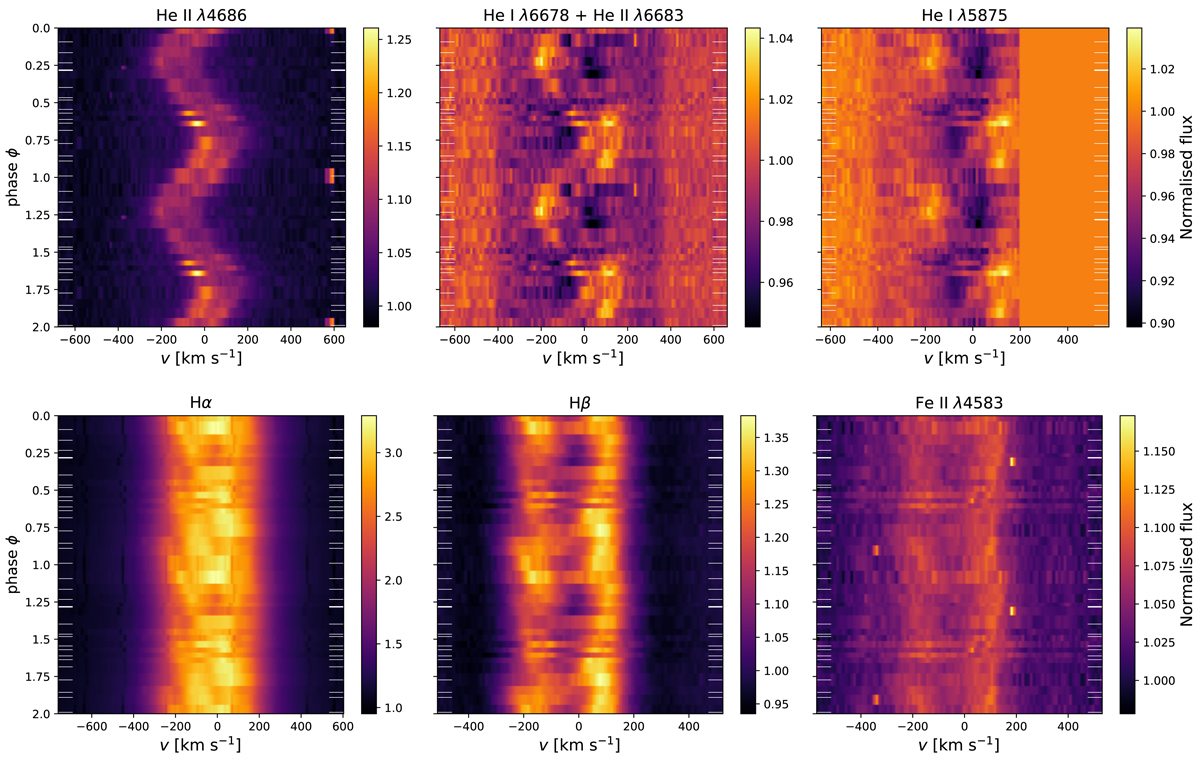
Download original image
Dynamical spectra of MWC 656. Phases are shown for two orbital periods. White horizontal bars indicate the phases at which HERMES spectra are taken. Top, from left to right: He IIλ4686, He Iλ6678 + He IIλ6683, He Iλ5875. Bottom, from left to right: Hα, Hβ, Fe IIλ4583. For He Iλ5875, part of the spectra where v > 200 km s−1 is put equal to one because of telluric contamination and contamination from the interstellar Na I line. Top-middle (He Iλ6678 + He IIλ6683) and -right (He Iλ5875) panels trace similar motion in emission as He IIλ4686 on top of the absorption coming from the Be star.
Current usage metrics show cumulative count of Article Views (full-text article views including HTML views, PDF and ePub downloads, according to the available data) and Abstracts Views on Vision4Press platform.
Data correspond to usage on the plateform after 2015. The current usage metrics is available 48-96 hours after online publication and is updated daily on week days.
Initial download of the metrics may take a while.