Fig. B.1.
Download original image
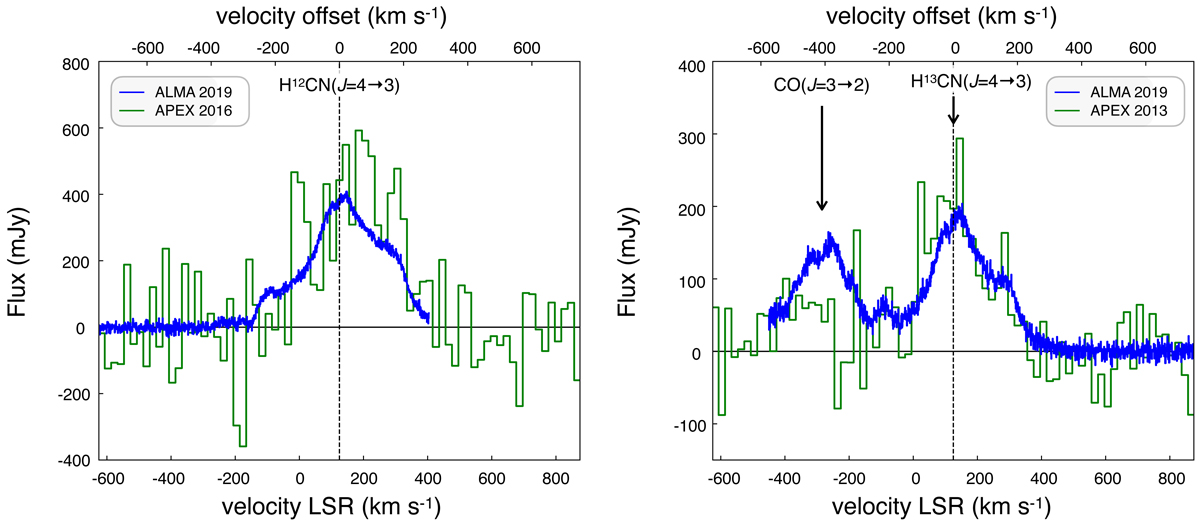
Sakurai’s Object H12CN(J = 4→3), H13CN(J = 4→3) and CO(J = 3→2) line emission. The green line is the spectrum of the emission line detected previously with APEX. The blue line is the spectrum observed with ALMA. The spectral resolutions of the APEX and ALMA observations are 20 km s−1 and 0.8 km s−1, respectively. The bottom axis indicates the local standard of rest velocity and the top axis indicates the velocity offset from the systemic velocity assumed to be 125 km s−1.
Current usage metrics show cumulative count of Article Views (full-text article views including HTML views, PDF and ePub downloads, according to the available data) and Abstracts Views on Vision4Press platform.
Data correspond to usage on the plateform after 2015. The current usage metrics is available 48-96 hours after online publication and is updated daily on week days.
Initial download of the metrics may take a while.