Fig. 3.

Download original image
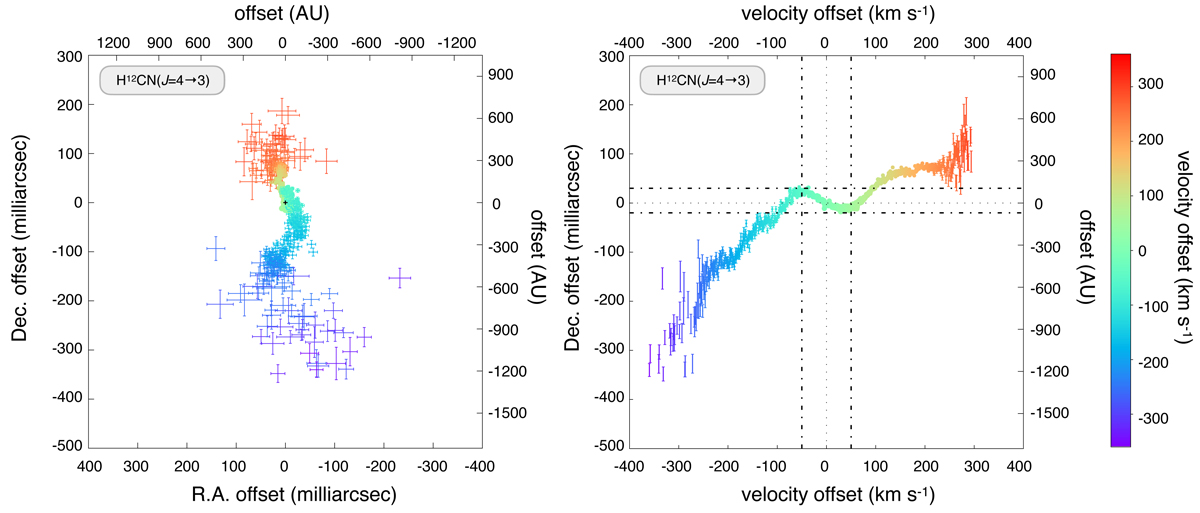
Spatial-kinematical distribution of the H12CN(J = 4 → 3) line emission in Sakurai’s object. Left: spatial distribution of the centroid positions of the H12CN(J = 4 → 3) line emission at each individual velocity channel. Right: position–velocity diagram of the H12CN(J = 4 → 3) line emission centroids along the Declination axis. The vertical and horizontal dashed lines indicate the velocity offset and Declination offset, respectively, over which an inversion of the velocity gradient is observed. The error bars correspond to the uncertainties of the centroid positions. The axis indicating the linear scale assumes a distance of 3.5 kpc to the source.
Current usage metrics show cumulative count of Article Views (full-text article views including HTML views, PDF and ePub downloads, according to the available data) and Abstracts Views on Vision4Press platform.
Data correspond to usage on the plateform after 2015. The current usage metrics is available 48-96 hours after online publication and is updated daily on week days.
Initial download of the metrics may take a while.


