Fig. 9.
Download original image
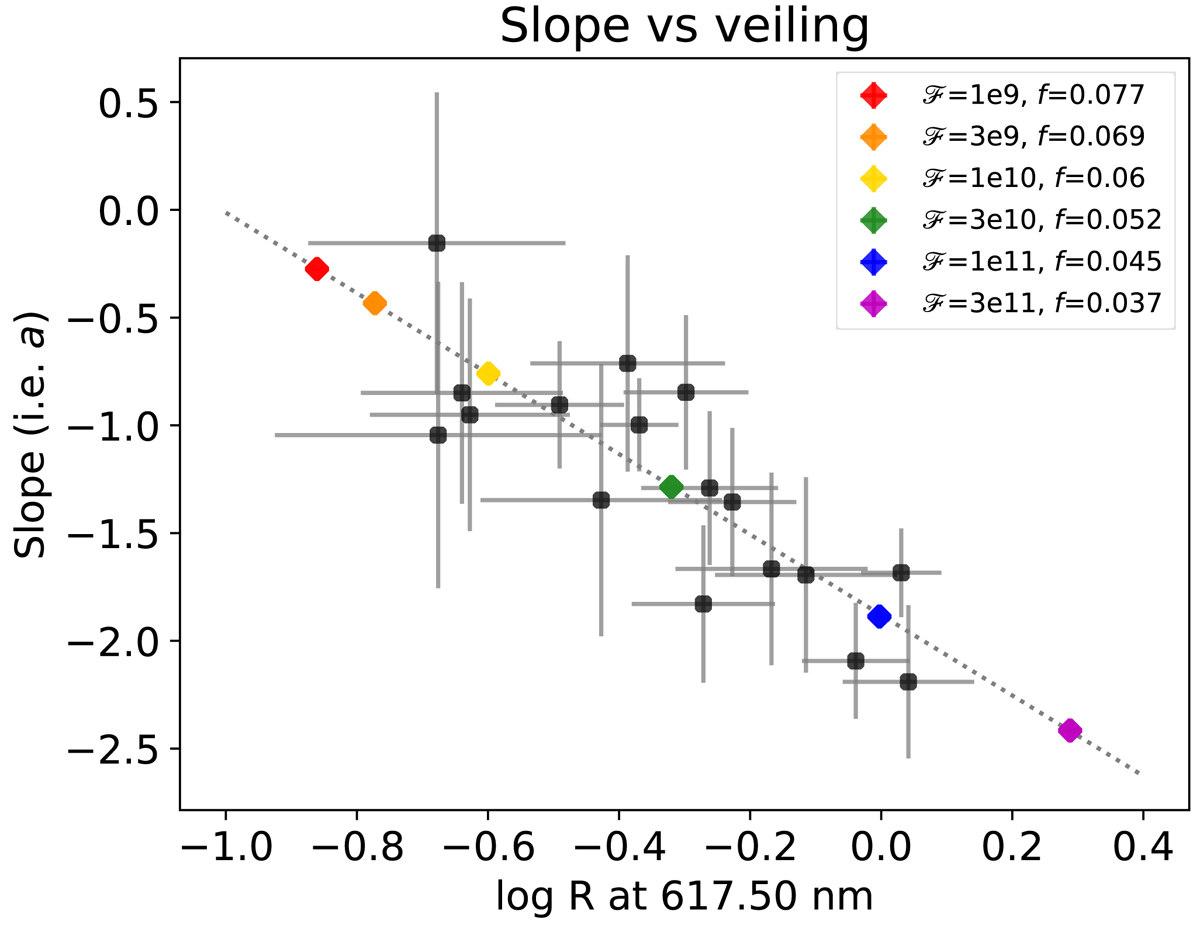
Slope of the veiling for the different models (diamonds in rainbow colors), and for the 2010 and 2012 observations (black dots) as a function of the veiling value at 617.50 nm. The vertical error bars are the errors on a, the horizontal ones are the uncertainty of the fits. The gray dotted line highlights the trend followed by the observations.
Current usage metrics show cumulative count of Article Views (full-text article views including HTML views, PDF and ePub downloads, according to the available data) and Abstracts Views on Vision4Press platform.
Data correspond to usage on the plateform after 2015. The current usage metrics is available 48-96 hours after online publication and is updated daily on week days.
Initial download of the metrics may take a while.