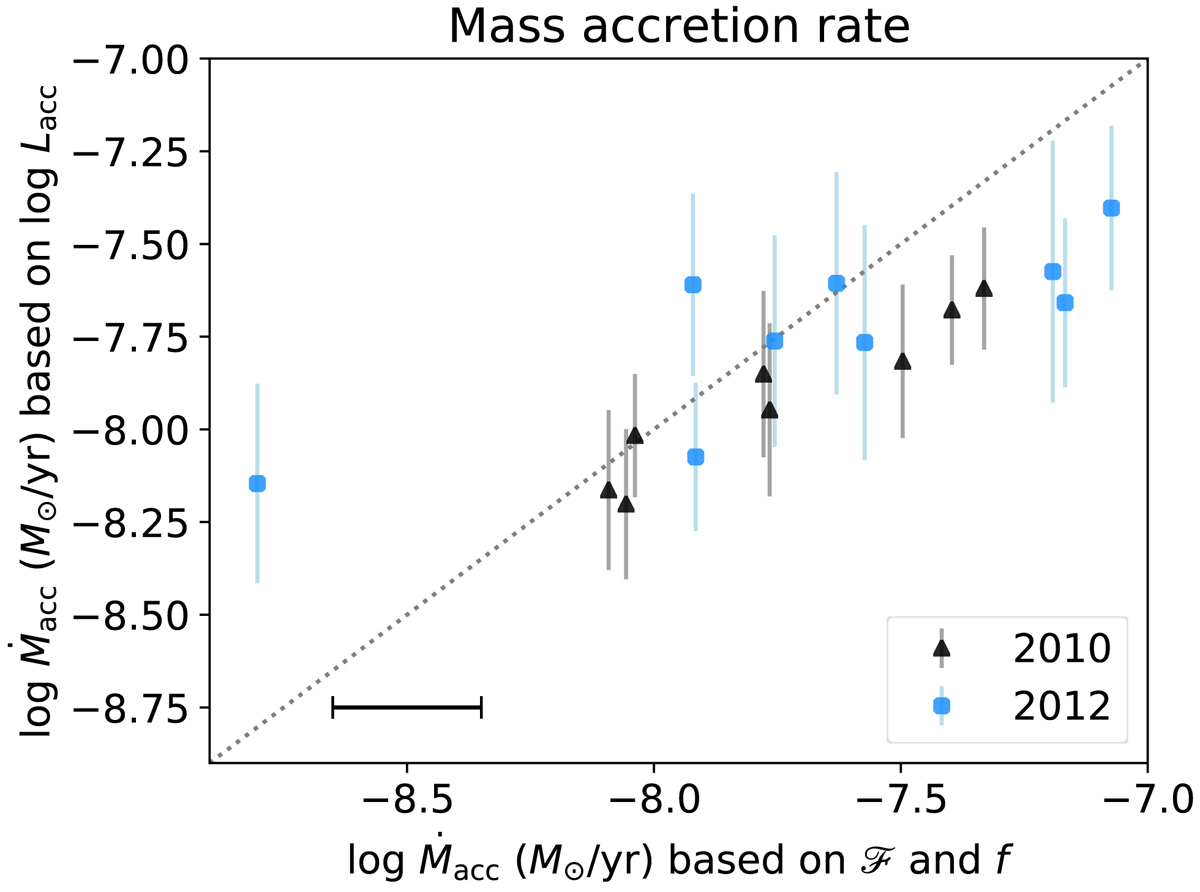
Fig. 14.
Download original image
Mass accretion rate based on the accretion luminosity as a function of the mass accretion rate based on ℱ and f, for the 2010 and 2012 data. The gray dotted line shows a one-to-one relationship. The uncertainty on the x-axis is shown on the lower left (see text for details). We note that the accretion shock model method finds almost systematically higher accretion rates than does the accretion luminosity method.
Current usage metrics show cumulative count of Article Views (full-text article views including HTML views, PDF and ePub downloads, according to the available data) and Abstracts Views on Vision4Press platform.
Data correspond to usage on the plateform after 2015. The current usage metrics is available 48-96 hours after online publication and is updated daily on week days.
Initial download of the metrics may take a while.