Open Access
Fig. 13.
Download original image
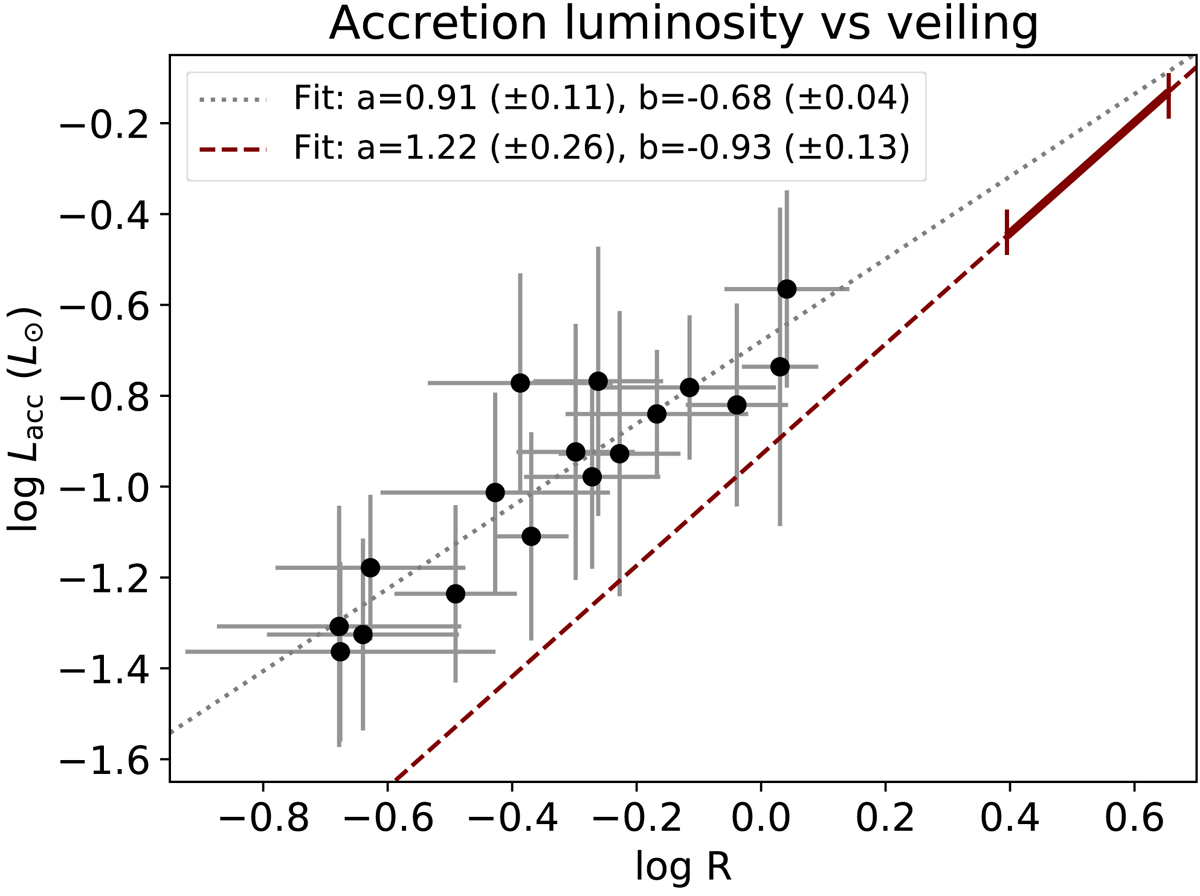
Accretion luminosity as a function of the veiling. The black dots show the range of values for DK Tau, the gray dotted line is the fit. The maroon dashed line shows the trend found for RU Lup by Stock et al. (2022), with the continuous maroon line highlighting their range.
Current usage metrics show cumulative count of Article Views (full-text article views including HTML views, PDF and ePub downloads, according to the available data) and Abstracts Views on Vision4Press platform.
Data correspond to usage on the plateform after 2015. The current usage metrics is available 48-96 hours after online publication and is updated daily on week days.
Initial download of the metrics may take a while.