Fig. 7.
Download original image
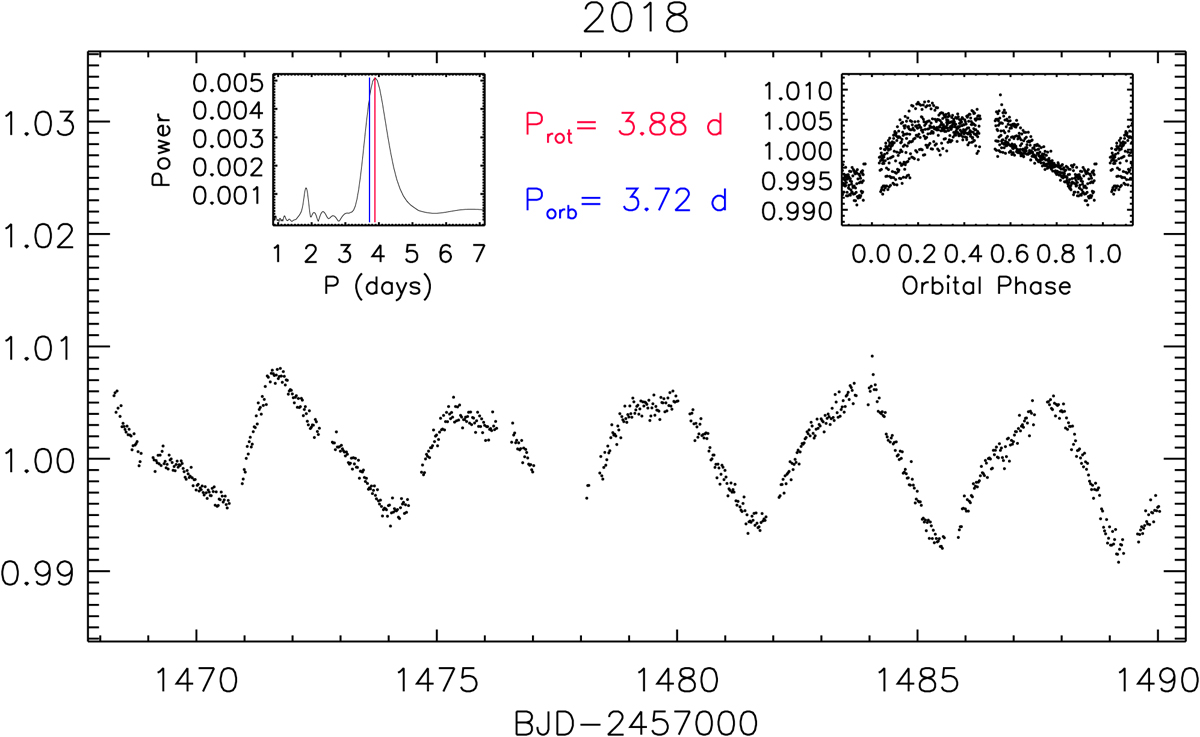
TESS SAP light curve of TIC 43152097 in 2018 (sector 6) where the eclipses have been removed. The inset in the upper left corner shows the cleaned periodogram; the rotational and orbital periods are marked with vertical red and blue lines, respectively. The inset in the upper right corner displays the data phased with the orbital period.
Current usage metrics show cumulative count of Article Views (full-text article views including HTML views, PDF and ePub downloads, according to the available data) and Abstracts Views on Vision4Press platform.
Data correspond to usage on the plateform after 2015. The current usage metrics is available 48-96 hours after online publication and is updated daily on week days.
Initial download of the metrics may take a while.