Fig. 6.
Download original image
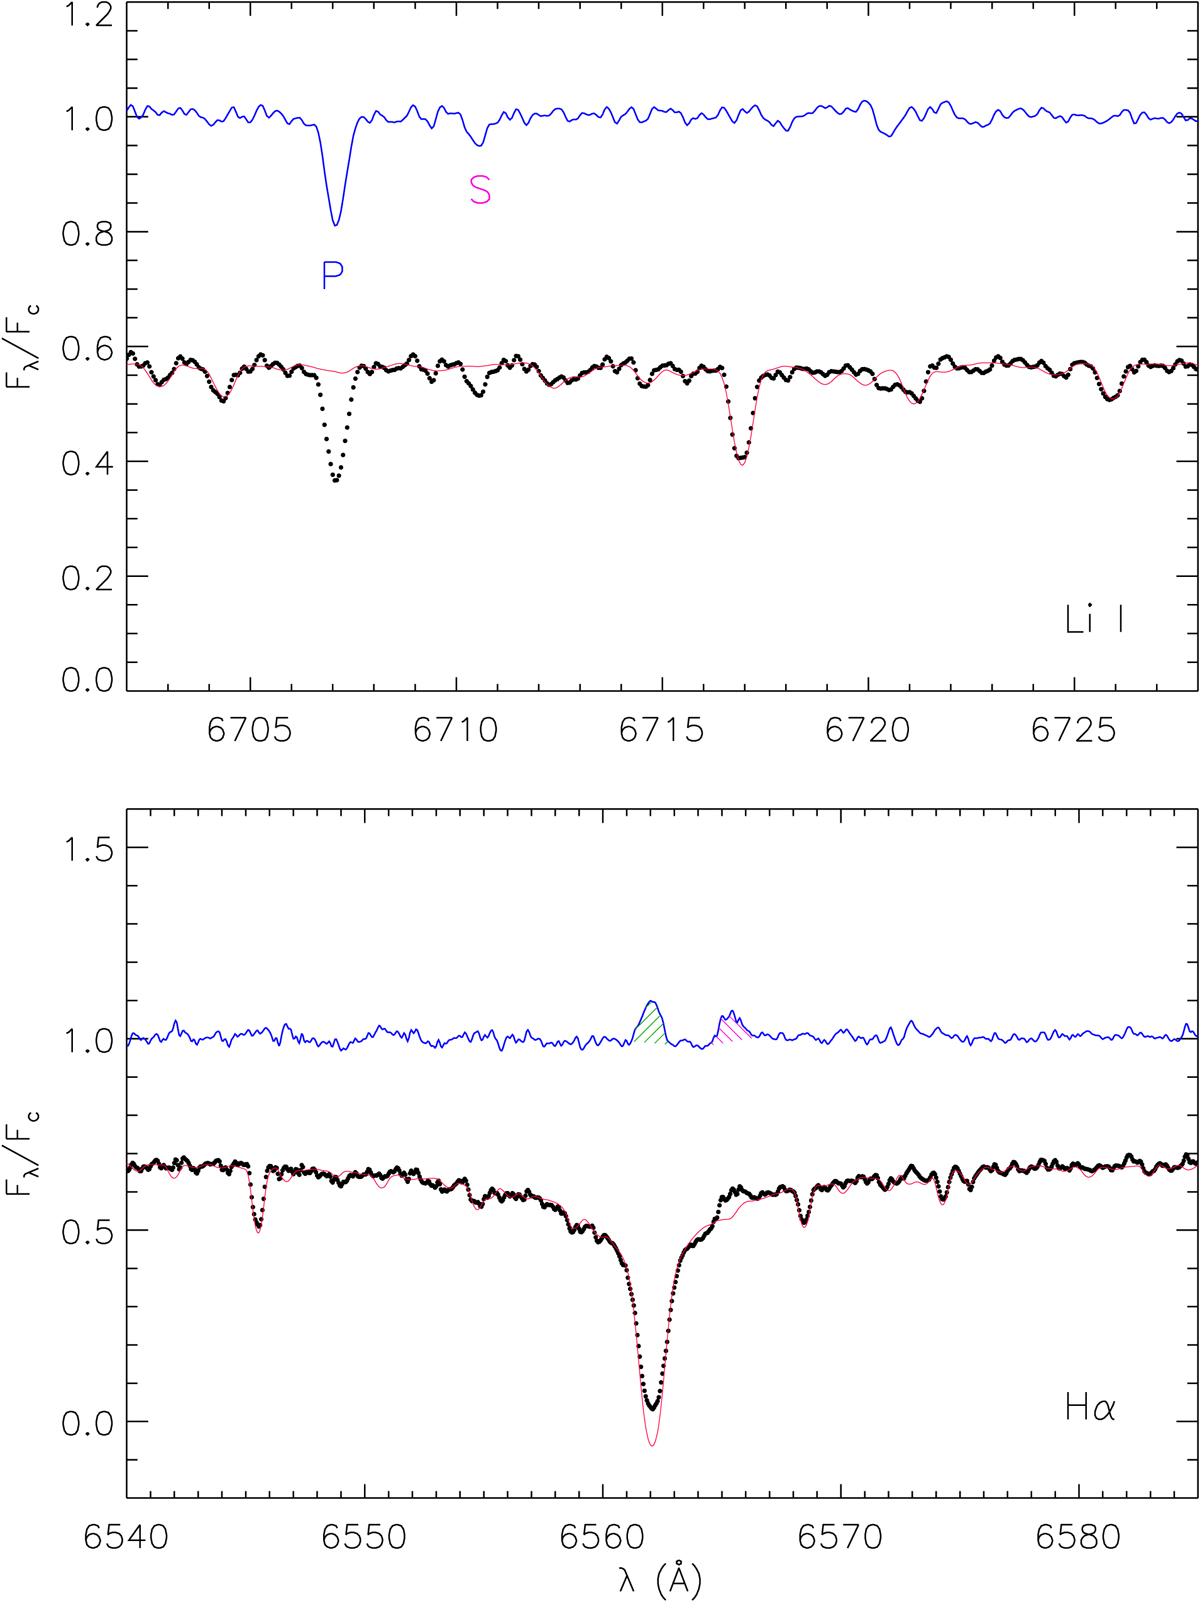
Subtraction of the synthetic composite spectrum (red line) generated by COMPO2 from the spectrum of TIC 43152097 observed on 28 October 2022 (black dots). In each panel, the residual spectrum is shown by the blue line. The chromospheric emission (bottom panel) in the Hα core of the primary and the secondary component, which has been integrated to provide ![]() , is shown by the hatched green and magenta areas, respectively. The Li Iλ6708 Å absorption lines of the two components (top panel) are marked with “P” and “S” in the residual spectrum.
, is shown by the hatched green and magenta areas, respectively. The Li Iλ6708 Å absorption lines of the two components (top panel) are marked with “P” and “S” in the residual spectrum.
Current usage metrics show cumulative count of Article Views (full-text article views including HTML views, PDF and ePub downloads, according to the available data) and Abstracts Views on Vision4Press platform.
Data correspond to usage on the plateform after 2015. The current usage metrics is available 48-96 hours after online publication and is updated daily on week days.
Initial download of the metrics may take a while.