Open Access
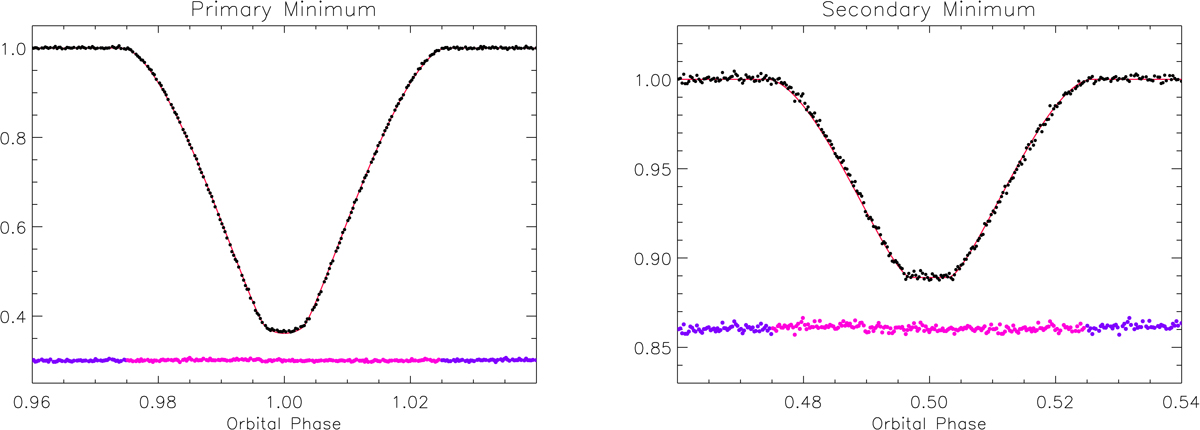
Fig. 4.
Download original image
Primary (left panel) and secondary (right panel) eclipse in the phased KSPSAP TESS light curve of sector 33 (black dots). The solid red lines represent the solution, and the blue dots at nearly zero level are the residuals (observed−model). The magenta dots are those used to calculate the χ2 of the fit.
Current usage metrics show cumulative count of Article Views (full-text article views including HTML views, PDF and ePub downloads, according to the available data) and Abstracts Views on Vision4Press platform.
Data correspond to usage on the plateform after 2015. The current usage metrics is available 48-96 hours after online publication and is updated daily on week days.
Initial download of the metrics may take a while.