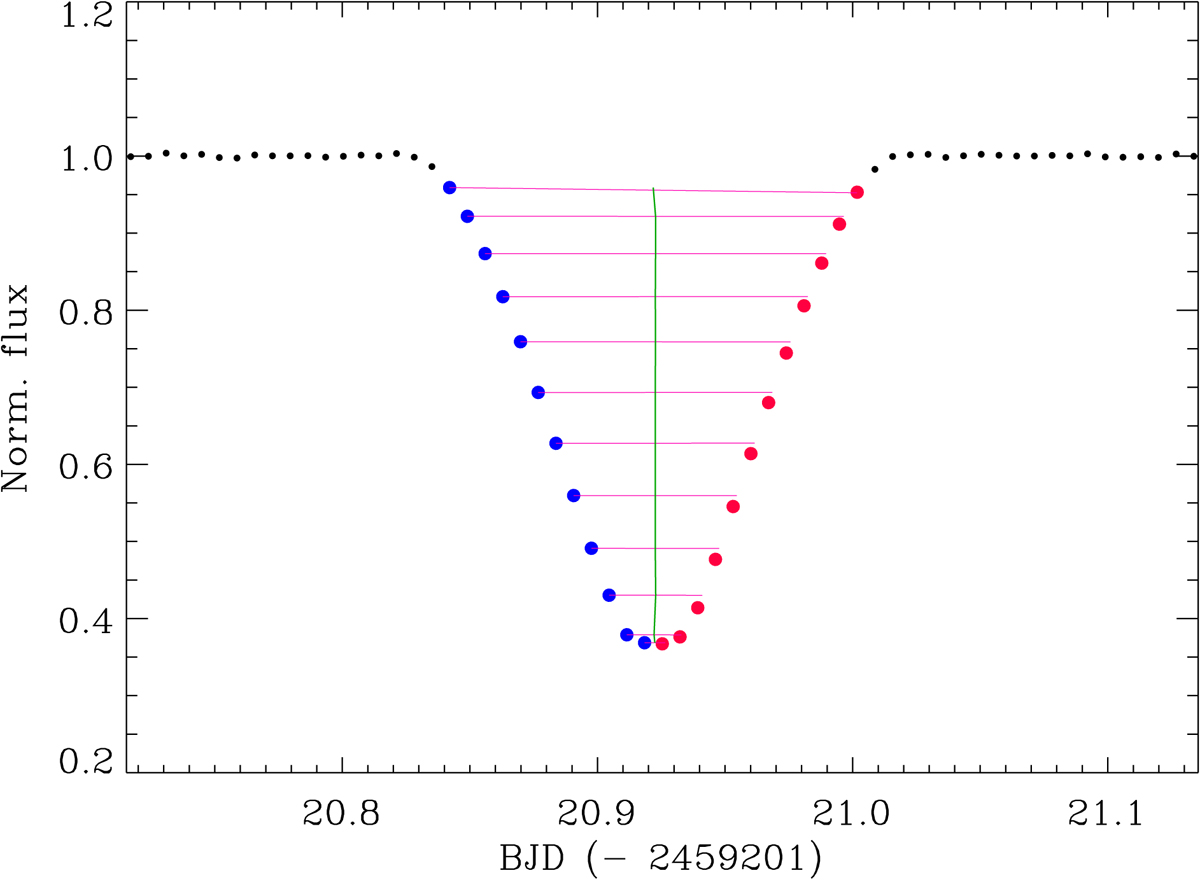
Fig. A.2.
Download original image
Example of the determination of the time of a light-curve minimum with the bisector method for the primary eclipse observed by TESS in sector 33 on 7 January 2021. The horizontal magenta lines connect points at the same flux level in the descending (blue dots) and rising (red dots) branch of the eclipse, interpolating between the two. The vertical green line represents the eclipse bisector.
Current usage metrics show cumulative count of Article Views (full-text article views including HTML views, PDF and ePub downloads, according to the available data) and Abstracts Views on Vision4Press platform.
Data correspond to usage on the plateform after 2015. The current usage metrics is available 48-96 hours after online publication and is updated daily on week days.
Initial download of the metrics may take a while.