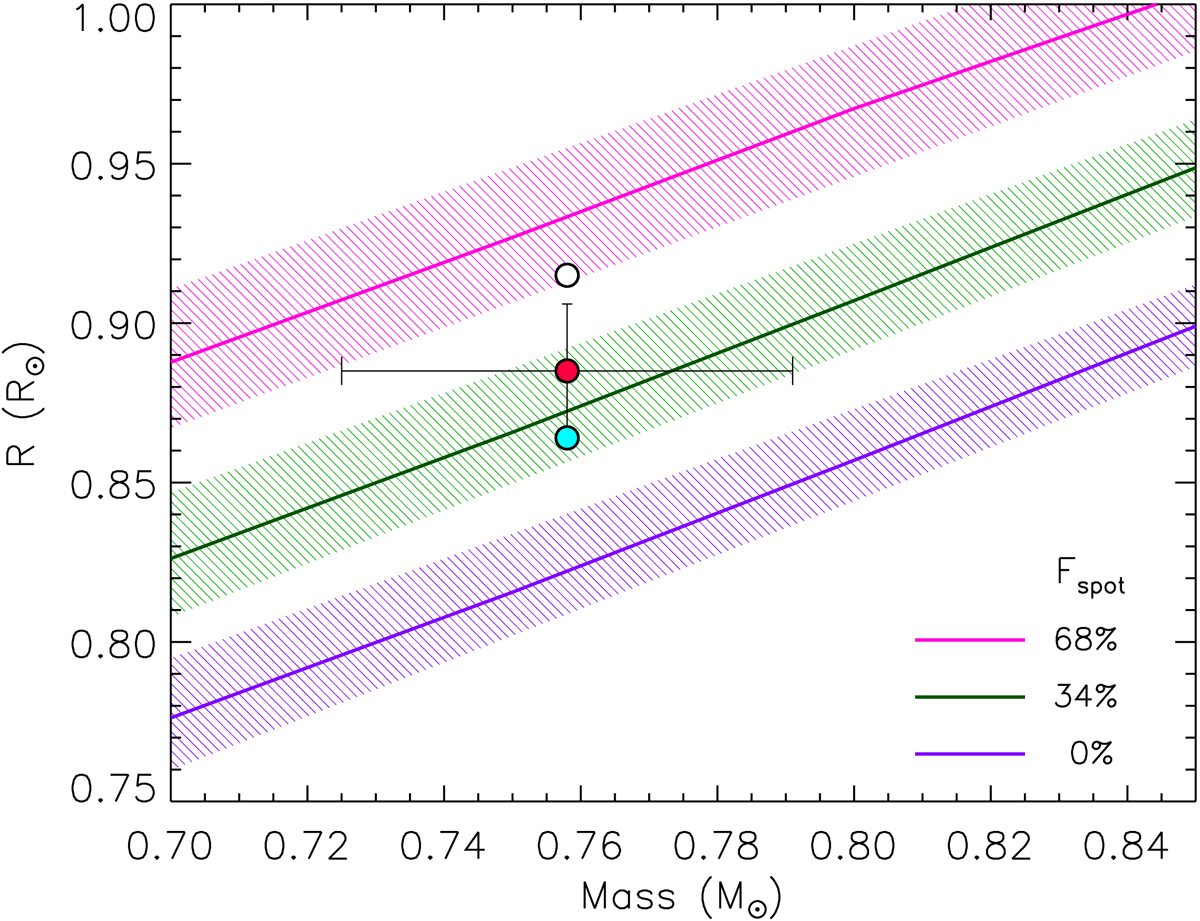
Fig. 11.
Download original image
Mass–radius diagram for the secondary component of TIC 43152097 (red dot). SPOT isochrones (Somers et al. 2020) at 28 Myr (log(age) = 7.45) for a spot covering factor of 0%, 34%, and 68% are overlaid with different colors, as indicated in the legend. The hatched areas delimit, per each value of Fspot, an age uncertainty of Δlog(age) = 0.05. As a comparison, the value derived with JKTEBOP assuming a third light L3 = 0 (R2 = 0.915 R⊙) is also shown by the white dot. A larger spot coverage is necessary to reproduce the observations in this case. The value of R2 = 0.865 R⊙, derived with JKTEBOP with the best-fit value of L3 = −0.094, is also overlaid with a cyan dot.
Current usage metrics show cumulative count of Article Views (full-text article views including HTML views, PDF and ePub downloads, according to the available data) and Abstracts Views on Vision4Press platform.
Data correspond to usage on the plateform after 2015. The current usage metrics is available 48-96 hours after online publication and is updated daily on week days.
Initial download of the metrics may take a while.