Fig. 2.
Download original image
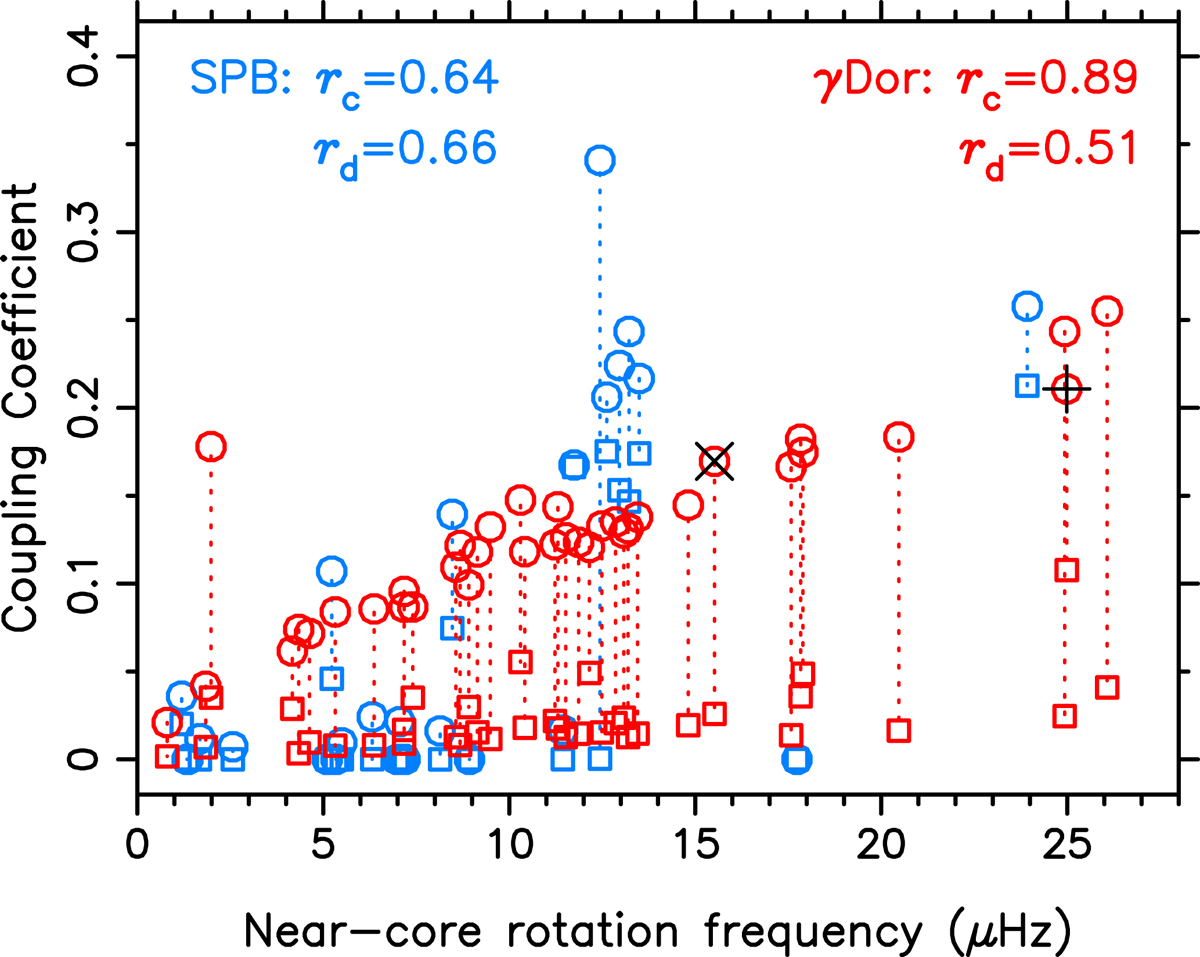
Values for ε in the case of a continuous (circles) and for ![]() in the limit of a discontinuous (squares) BV profile plotted as a function of the near-core rotation frequency. The γ Dor and SPB stars are indicated in red and blue, respectively. The two γ Dor stars for which Saio et al. (2021) detected a signature of coupling between a core and envelope mode are overplotted with black symbols, namely, KIC 11907454 (cross) and KIC 12066947 (plus). Linear correlation coefficients, rc and rd, between ω and ε, respectively
in the limit of a discontinuous (squares) BV profile plotted as a function of the near-core rotation frequency. The γ Dor and SPB stars are indicated in red and blue, respectively. The two γ Dor stars for which Saio et al. (2021) detected a signature of coupling between a core and envelope mode are overplotted with black symbols, namely, KIC 11907454 (cross) and KIC 12066947 (plus). Linear correlation coefficients, rc and rd, between ω and ε, respectively ![]() , are listed for the two samples.
, are listed for the two samples.
Current usage metrics show cumulative count of Article Views (full-text article views including HTML views, PDF and ePub downloads, according to the available data) and Abstracts Views on Vision4Press platform.
Data correspond to usage on the plateform after 2015. The current usage metrics is available 48-96 hours after online publication and is updated daily on week days.
Initial download of the metrics may take a while.