Fig. A.3.
Download original image
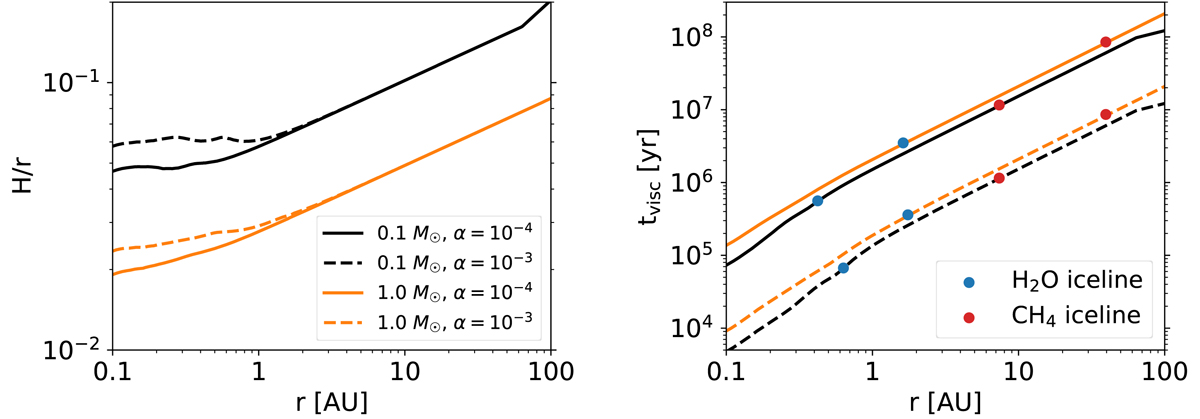
Comparison of disc properties for a disc around an M dwarf and a solar-type star in our model. Left: Aspect ratio of a disc around a 0.1 M⊙ star (black lines) and a disc around a 1.0 M⊙ star (orange lines) for low (solid lines) and high (dashed lines) disc viscosities. Right: Viscous accretion timescale of the discs as a function of radial distance, stellar mass, and disc viscosity. Solid circles indicate the location of the water-ice (blue) and CH4-ice (red) lines in each disc.
Current usage metrics show cumulative count of Article Views (full-text article views including HTML views, PDF and ePub downloads, according to the available data) and Abstracts Views on Vision4Press platform.
Data correspond to usage on the plateform after 2015. The current usage metrics is available 48-96 hours after online publication and is updated daily on week days.
Initial download of the metrics may take a while.