Fig. 1.
Download original image
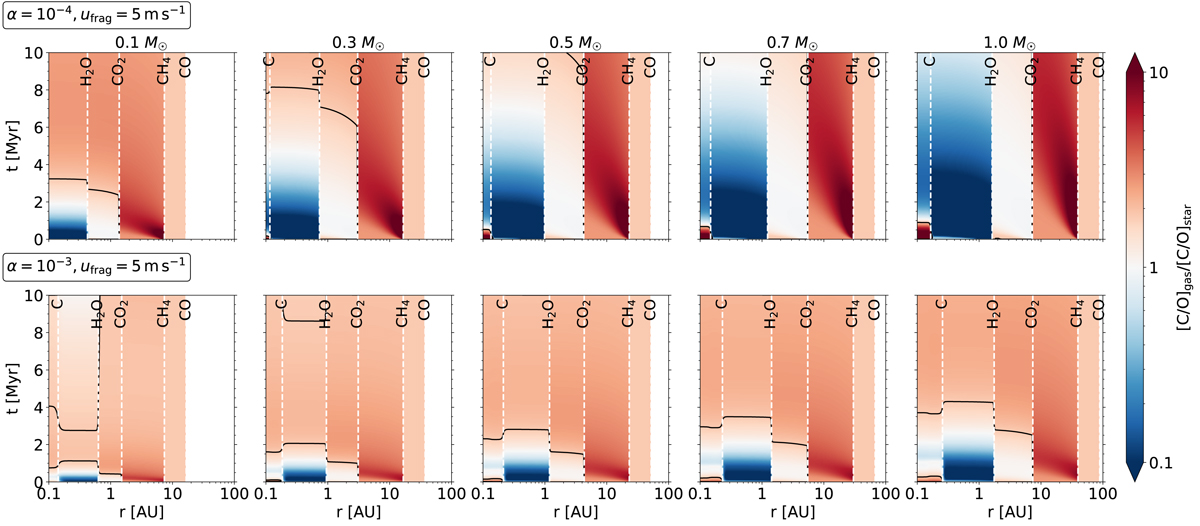
Temporal evolution of the gas disc C/O ratio (normalised to the stellar value) as a function of distance from the star, stellar mass (left to right), and disc viscosity (top and bottom rows). Ice lines are marked by vertical dashed white lines, and solid black lines indicate an absolute C/O ratio of 1. The carbon line is absent in the top leftmost panel because it is located inside 0.1 AU. Outside the CO ice line (Tdisc ≤ 20 K; white region in the subplots), all chemical species are assumed to be frozen in the solid phase.
Current usage metrics show cumulative count of Article Views (full-text article views including HTML views, PDF and ePub downloads, according to the available data) and Abstracts Views on Vision4Press platform.
Data correspond to usage on the plateform after 2015. The current usage metrics is available 48-96 hours after online publication and is updated daily on week days.
Initial download of the metrics may take a while.