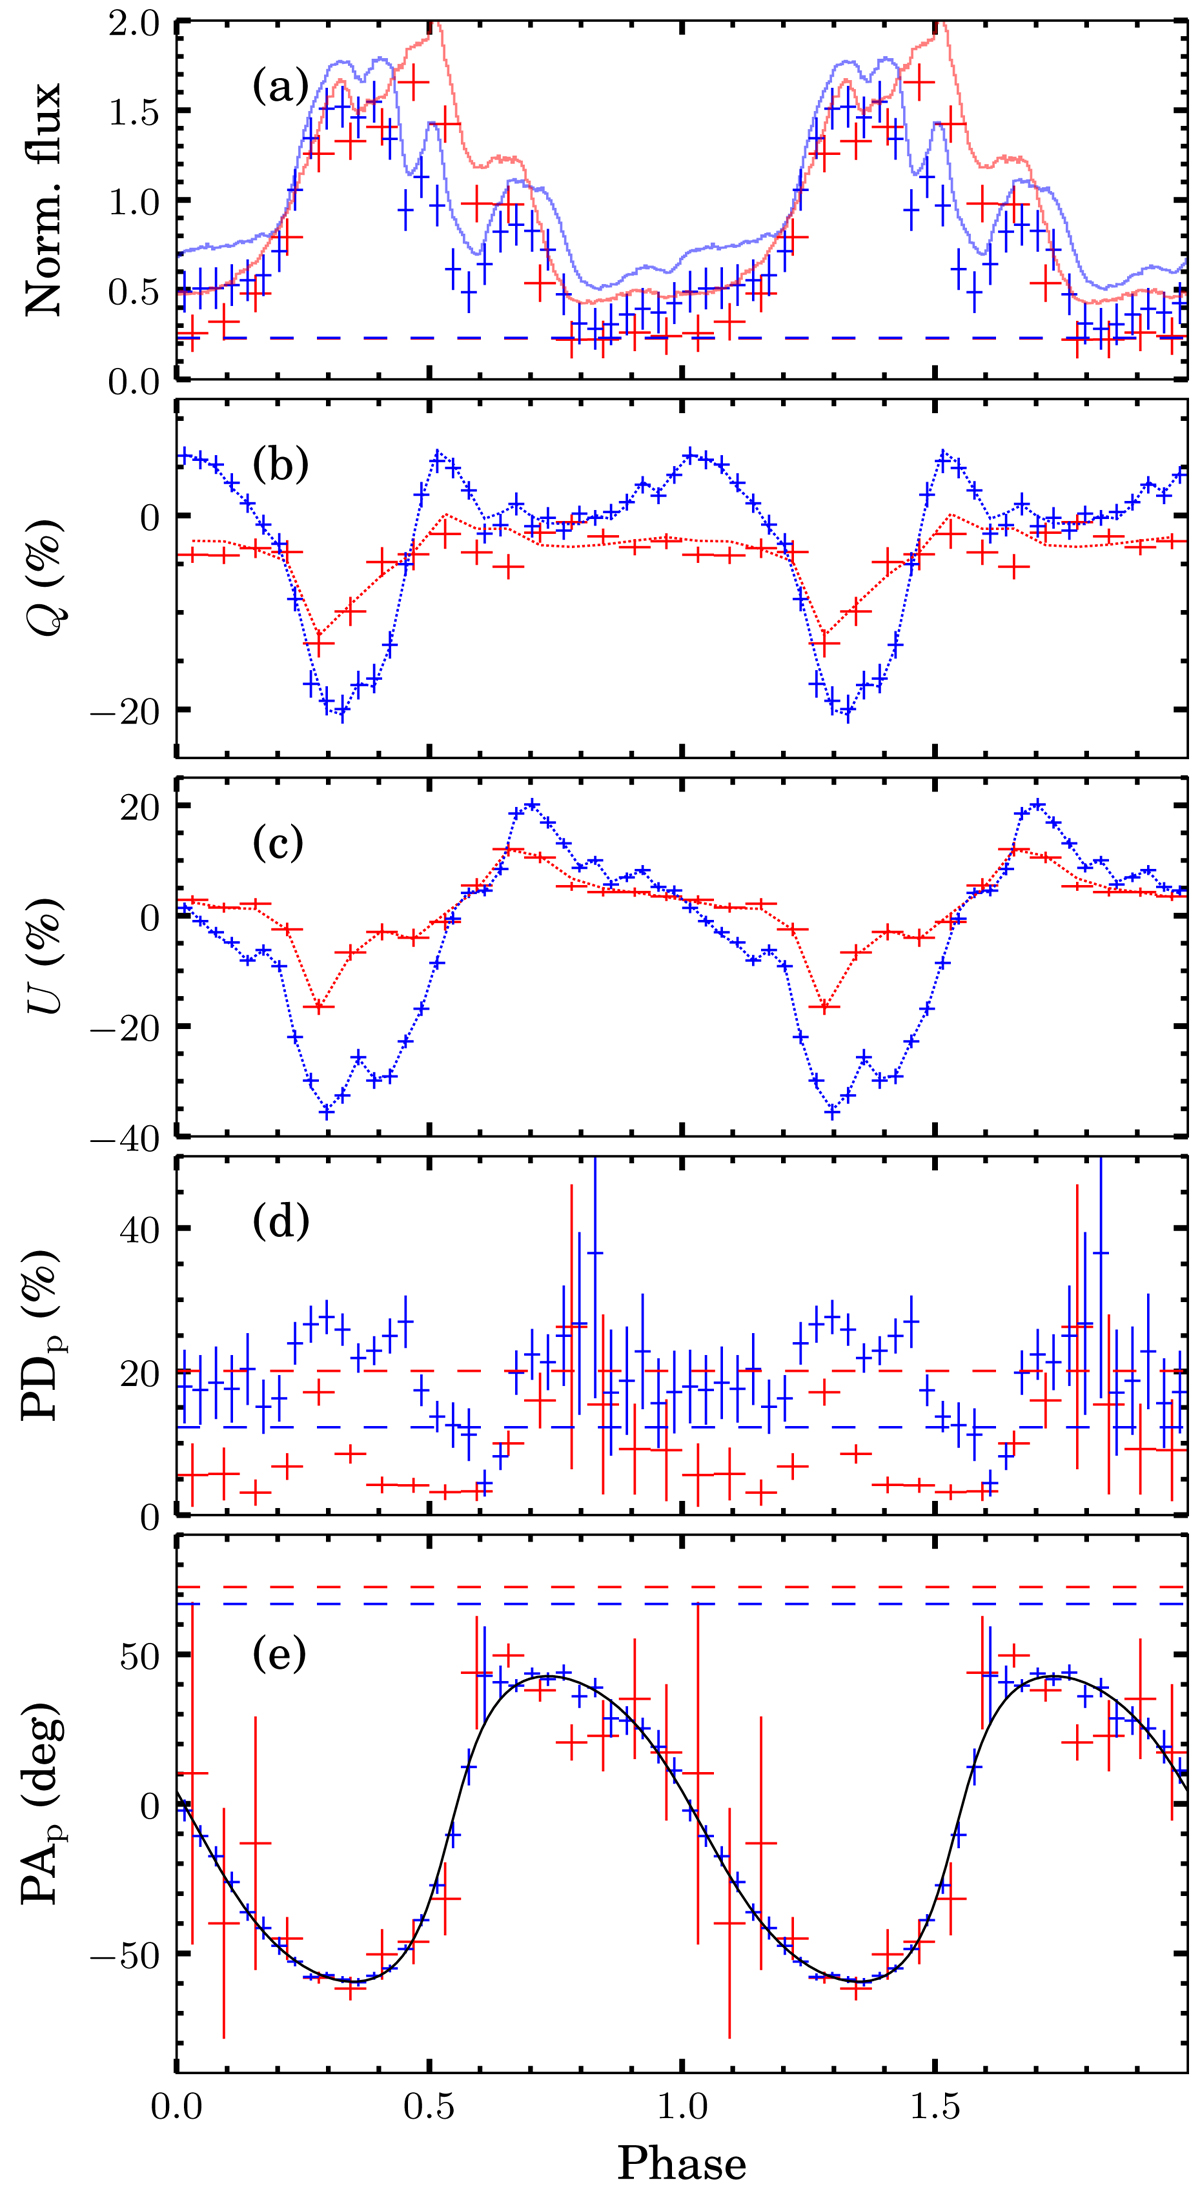
Fig. 6.
Download original image
Results for the two-component model corresponding to the best-fit parameters listed in Fig. 7. Panel a shows the total normalized flux (solid lines), the mean value for the constant component (Ic, 1 = Ic, 2 = 0.23, horizontal dashed lines), and the flux of the variable component accounting for the uncertainty in the constant component (crosses). Panels b and c show the observed Stokes parameters normalized to the average flux (crosses) and the best-fit model (dotted lines). Panels d and e show the PD and PA for constant (horizontal dashed lines) and variable (crosses) components, respectively. The solid line in panel e matches the solid set of lines in Fig. 3e with the constant component subtracted. Red and blue symbols and lines correspond to Obs. 1 and Obs. 2, respectively.
Current usage metrics show cumulative count of Article Views (full-text article views including HTML views, PDF and ePub downloads, according to the available data) and Abstracts Views on Vision4Press platform.
Data correspond to usage on the plateform after 2015. The current usage metrics is available 48-96 hours after online publication and is updated daily on week days.
Initial download of the metrics may take a while.