Fig. 2.
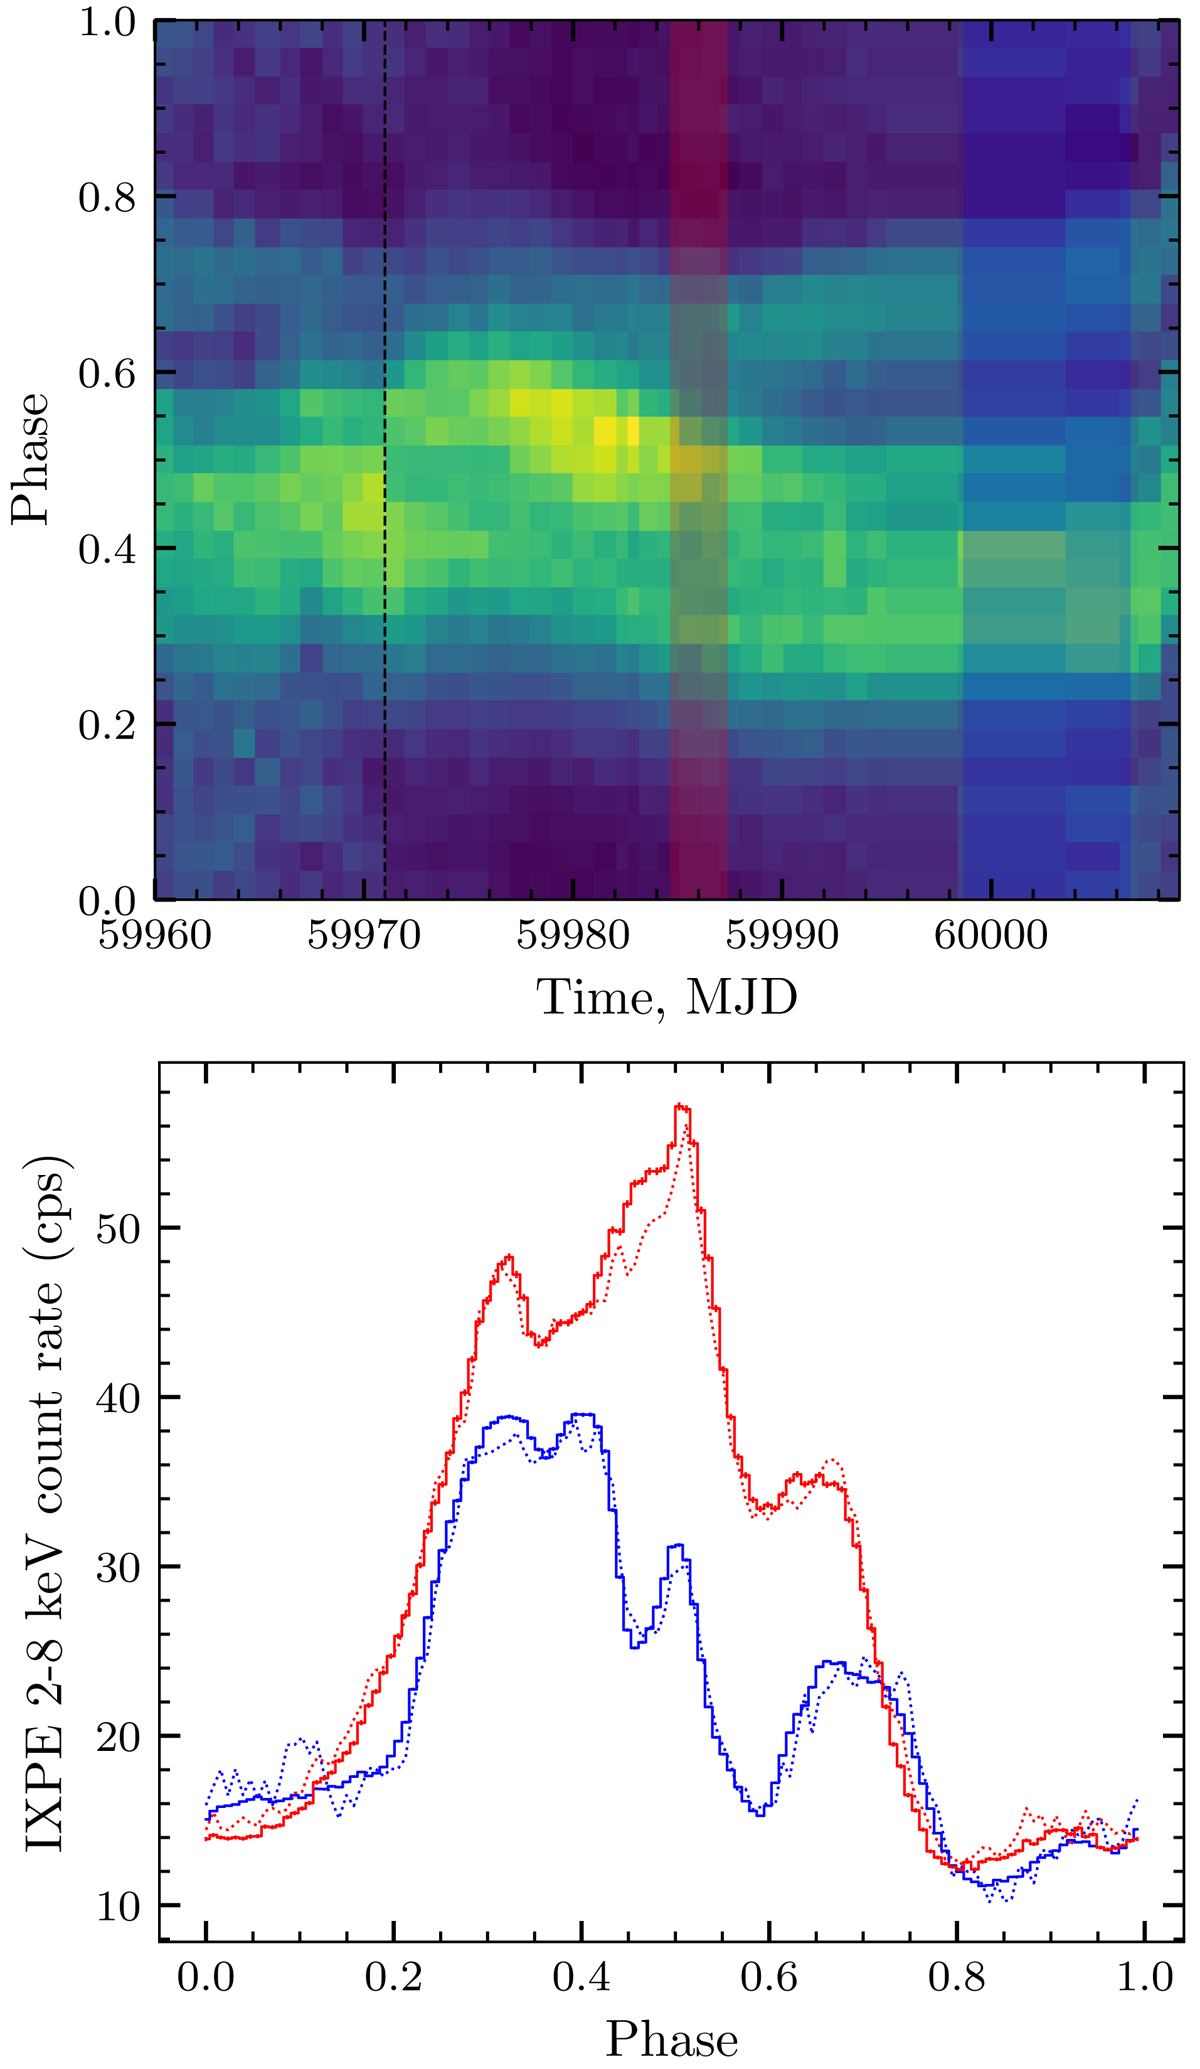
Download original image
Evolution of the pulse profiles during the outburst. Top: color-coded normalized pulse profiles as observed by NICER. Slices in the vertical direction correspond to pulse profiles in individual NICER observations, the shaded strips mark the times of IXPE observations, and the vertical dashed line is the same as in Fig. 1. Bottom: pulse profiles in the 2−8 keV band observed by IXPE in two observations (histogram) and NICER during the same period (dotted line, scaled to match the IXPE count rate).
Current usage metrics show cumulative count of Article Views (full-text article views including HTML views, PDF and ePub downloads, according to the available data) and Abstracts Views on Vision4Press platform.
Data correspond to usage on the plateform after 2015. The current usage metrics is available 48-96 hours after online publication and is updated daily on week days.
Initial download of the metrics may take a while.