Fig. 5
Download original image
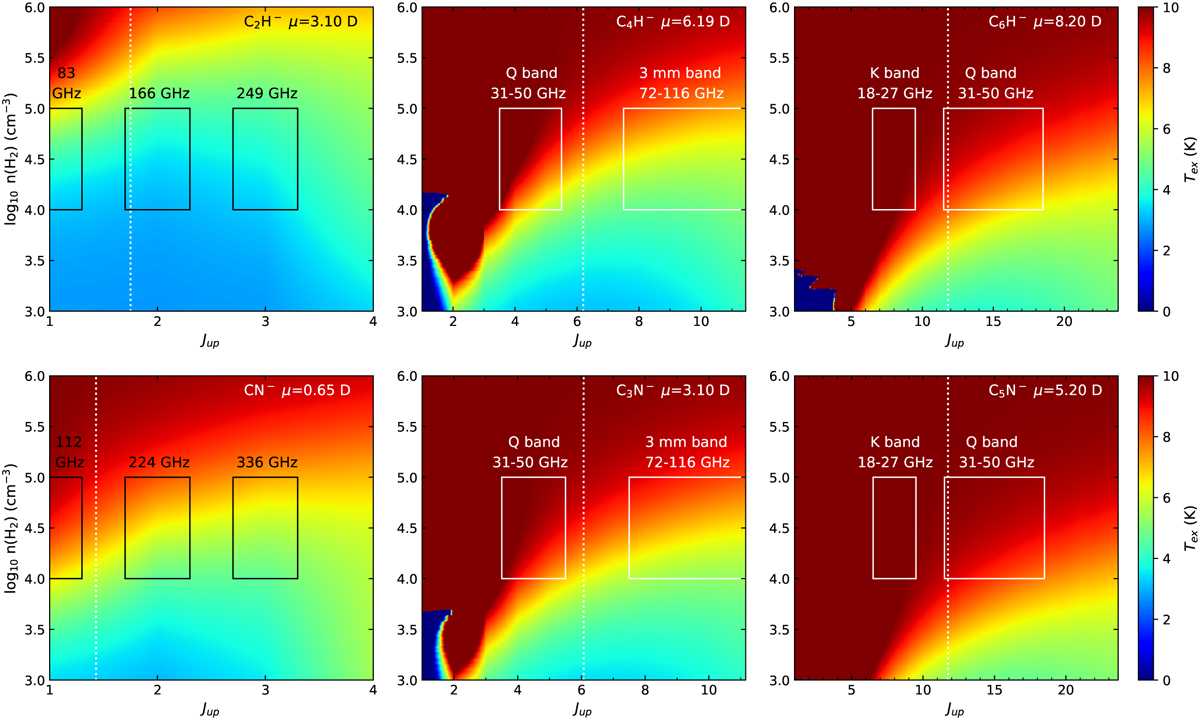
Excitation temperature (color-coded map) as a function of quantum number of upper level (x-axis) and H2 volume density (y-axis) for six negative molecular anions as obtained from LVG calculations adopting a gas kinetic temperature of 10 K, a column density of 1011 cm−2, and a linewidth of 0.5 km s−1. The references for the dipole moments are Brünken et al. (2007b) for C2H−, Botschwina (2000) for C4H−, Blanksby et al. (2001) for C6H−, Botschwina et al. (1995) for CN−, Thaddeus et al. (2008) and Kołos et al. (2008) for C3N−, and Botschwina & Oswald (2008) for C5N−. For reference, the white dotted vertical line indicates the J level at which the energy is 10 K. The microwave and mm spectral regions observable with radiotelescopes are indicated. The small dark blue regions in the bottom-left corner of the C4H−, C6H−, and C3N− panels correspond to negative excitation temperatures.
Current usage metrics show cumulative count of Article Views (full-text article views including HTML views, PDF and ePub downloads, according to the available data) and Abstracts Views on Vision4Press platform.
Data correspond to usage on the plateform after 2015. The current usage metrics is available 48-96 hours after online publication and is updated daily on week days.
Initial download of the metrics may take a while.