Fig. 10
Download original image
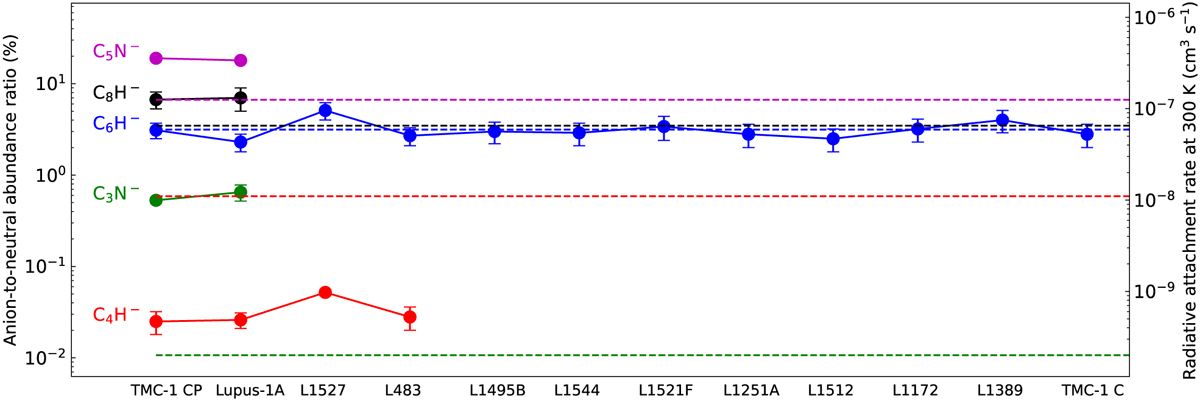
Observed anion-to-neutral abundance ratios (referred to the left y axis) in cold interstellar clouds where molecular anions have been detected to date. Values are given in Table 4. Referred to the right y axis and following the same color code we also plot as dotted horizontal lines the calculated rate coefficients at 300 K for the reaction of radiative electron attachment to the neutral counterpart. Adopted values are 1.1 × 10⁻⁸ cm3 s−1 for C4H, 6.2 × 10⁻⁸ cm3 s−1 for C6H and C8H (Herbst & Osamura 2008; they are shown slightly displaced for visualization purposes), 2.0 × 10⁻¹⁰ cm3 s−1 for C3N (Petrie & Herbst 1997; Harada & Herbst 2008), and 1.25 × 10⁻⁷ cm3 s−1 for C5N (Walsh et al. 2009). The scale of the right y axis is chosen to make the rate coefficient of electron attachment to C6H to coincide with the mean of C6H−/C6H ratios and to cover the same range in logarithmic scale than the left y axis, which allows to visualize any potential proportionality between anion-to-neutral ratio and radiative electron attachment rate.
Current usage metrics show cumulative count of Article Views (full-text article views including HTML views, PDF and ePub downloads, according to the available data) and Abstracts Views on Vision4Press platform.
Data correspond to usage on the plateform after 2015. The current usage metrics is available 48-96 hours after online publication and is updated daily on week days.
Initial download of the metrics may take a while.