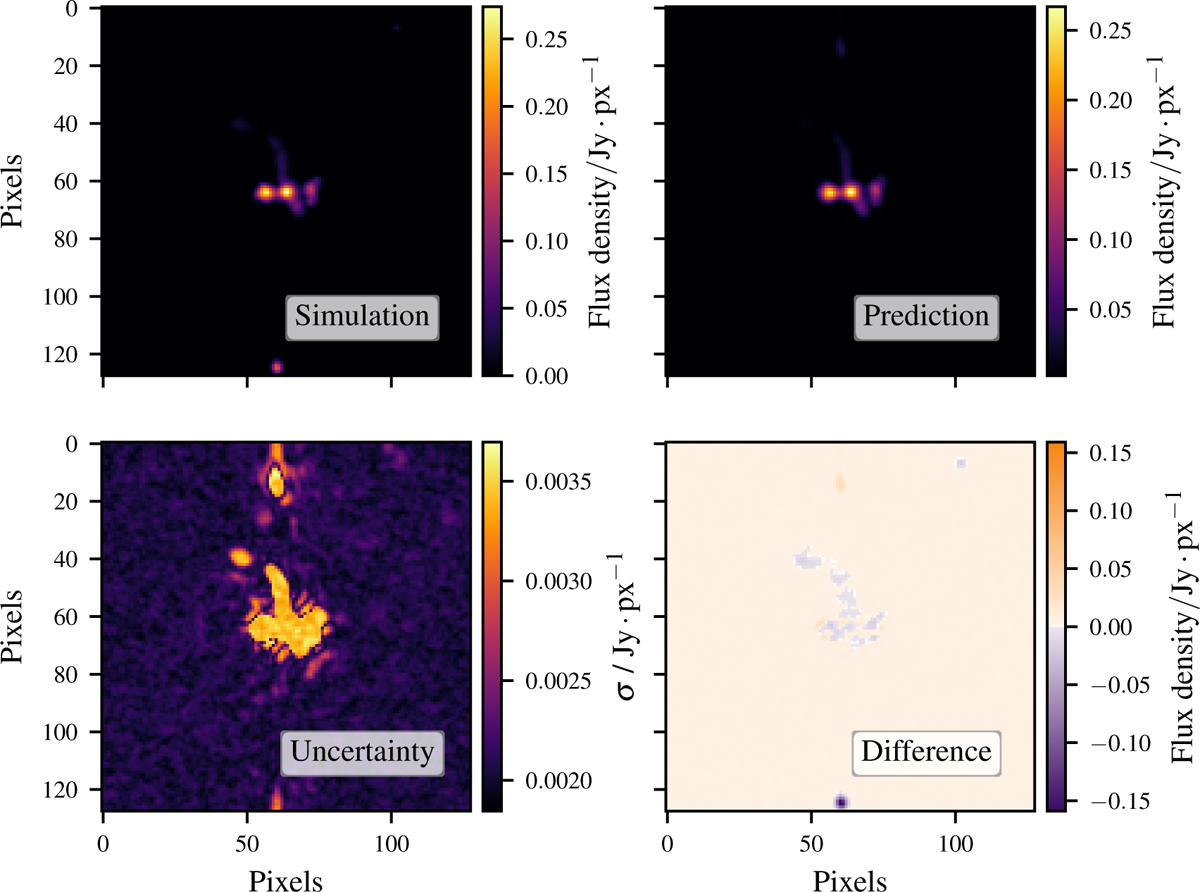
Fig. 18
Download original image
Reconstruction and uncertainty map of a radio galaxy from the test data set. While the shown source reconstruction (upper right) is generated by calculating the mean of the sampled reconstructions, their standard deviation gives the uncertainty map (lower left). Simulated source distribution (upper left) and prediction agree well, which is reflected by their difference map (lower right).
Current usage metrics show cumulative count of Article Views (full-text article views including HTML views, PDF and ePub downloads, according to the available data) and Abstracts Views on Vision4Press platform.
Data correspond to usage on the plateform after 2015. The current usage metrics is available 48-96 hours after online publication and is updated daily on week days.
Initial download of the metrics may take a while.