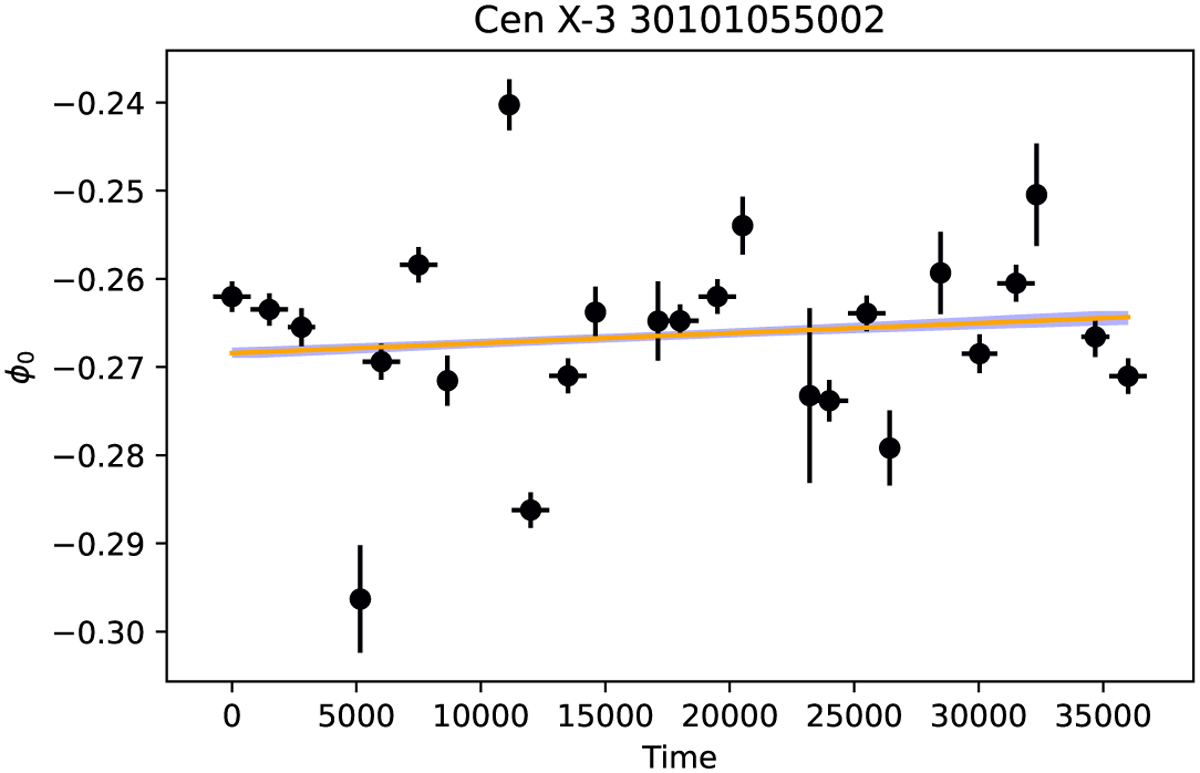
Fig. 2
Download original image
First-harmonic phase of time-resolved pulse profiles extracted along the Cen X-3 observation on 2015 November 30 with time tagged since its start. Pulses are extracted every 1500 s and rebinned to achieve a S/N of 15. The solid line with spread indicates the best linear trend and its 1σ envelope. The phases are obtained by folding the light curve using the period and period derivative shown in Table 1.
Current usage metrics show cumulative count of Article Views (full-text article views including HTML views, PDF and ePub downloads, according to the available data) and Abstracts Views on Vision4Press platform.
Data correspond to usage on the plateform after 2015. The current usage metrics is available 48-96 hours after online publication and is updated daily on week days.
Initial download of the metrics may take a while.