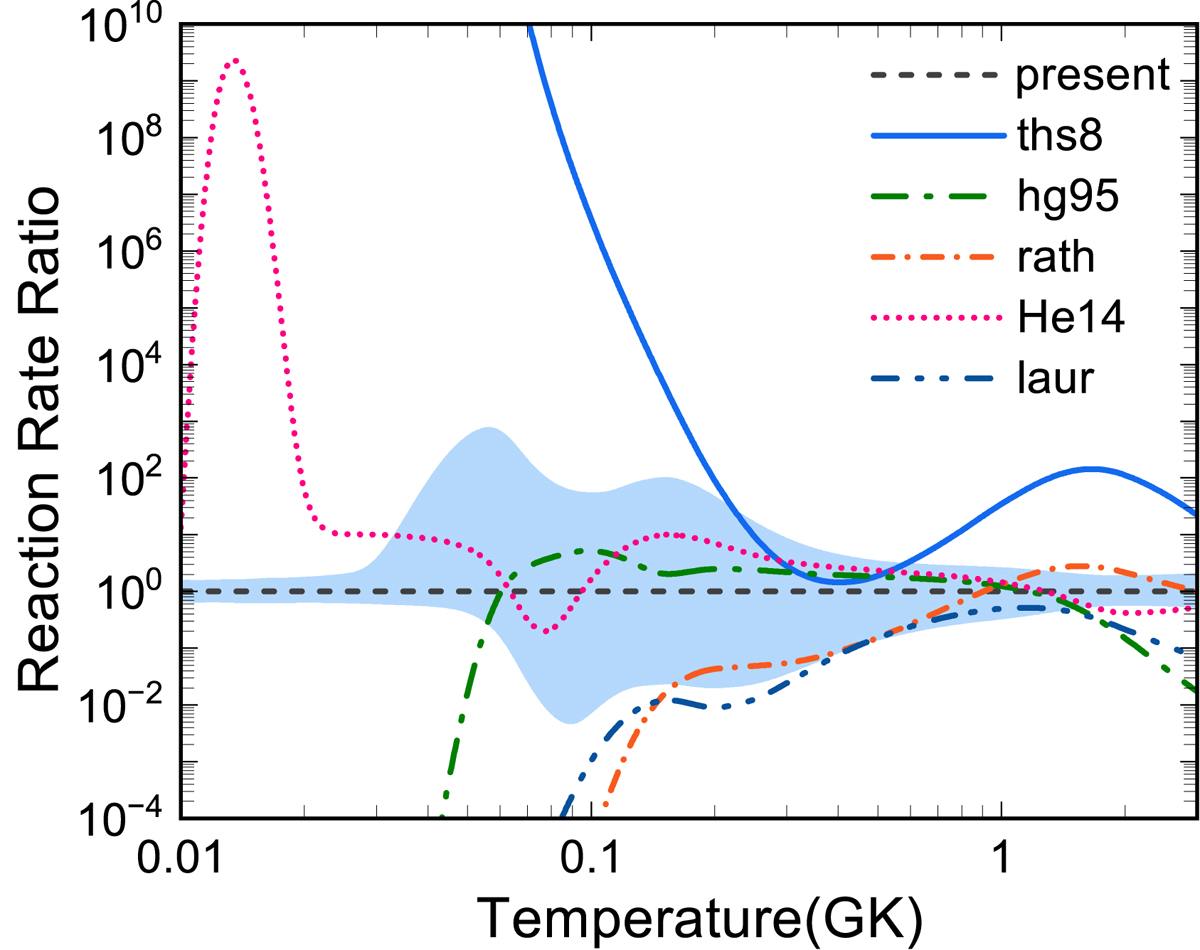
Fig. 2.
Download original image
Ratio of previous rates 42Ti(p,γ)43V normalized to present recommended rates (the median rates in Table 2). The different patterns of lines correspond to the rates from Van Wormer et al. (1994, laur), Herndl et al. (1995, hg95), Rauscher & Thielemann (2000, rath), Cyburt et al. (2010, ths8), and He et al. (2014, He14). The shallow blue-shaded areas correspond to 68% coverage probabilities, shown as Low and High in Table 2.
Current usage metrics show cumulative count of Article Views (full-text article views including HTML views, PDF and ePub downloads, according to the available data) and Abstracts Views on Vision4Press platform.
Data correspond to usage on the plateform after 2015. The current usage metrics is available 48-96 hours after online publication and is updated daily on week days.
Initial download of the metrics may take a while.