Fig. 3.
Download original image
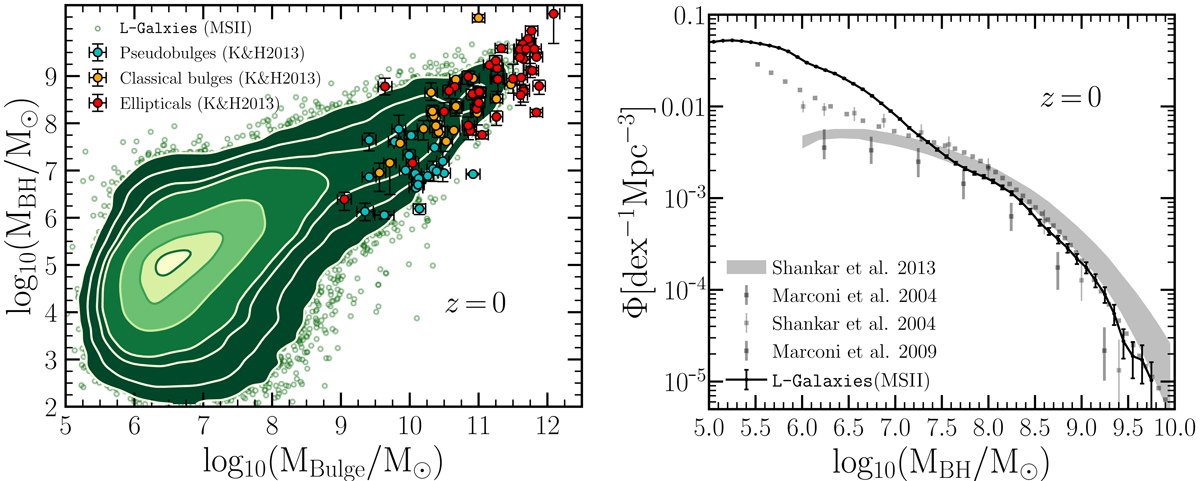
General properties of MBHs in L-Galaxies SAM applied in the Millennium-II merger trees. Left panel: 2D histogram of the bulge-black hole correlation at z = 0. The predictions are compared with the observations of Kormendy & Ho (2013; K&H2013) where blue, orange, and red points correspond to pseudobulges, classical bulges, and ellipticals, respectively. Right panel: black hole mass function at z = 0 when the model is run on top of the Millennium-II merger trees (black lines). Error bars correspond to the Poissonian error. For comparison, we have added the observational constraints of Marconi et al. (2004) and Shankar et al. (2004, 2009, 2013).
Current usage metrics show cumulative count of Article Views (full-text article views including HTML views, PDF and ePub downloads, according to the available data) and Abstracts Views on Vision4Press platform.
Data correspond to usage on the plateform after 2015. The current usage metrics is available 48-96 hours after online publication and is updated daily on week days.
Initial download of the metrics may take a while.