Fig. 13.
Download original image
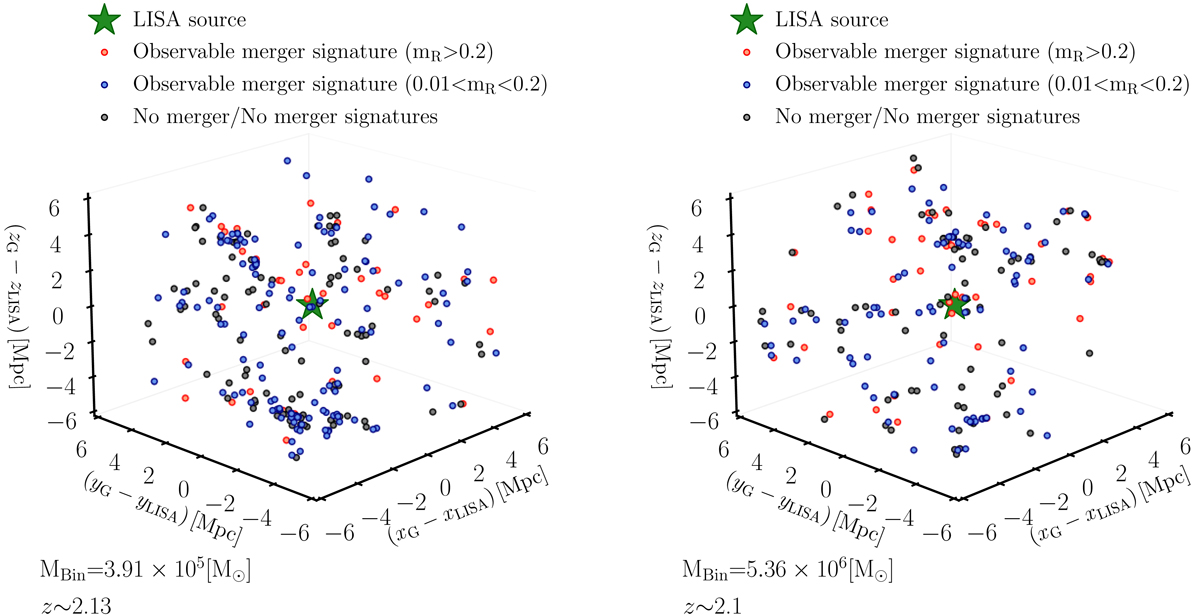
Sky map of a LISA source at z ∼ 2 in the simulated universe. The left panel displays the case of a MBin = 105 − 106 M⊙ LISA MBHB, and the right panel corresponds to a MBHB of 106 − 107 M⊙. Each dot corresponds to a galaxy with a mass of 108 < Mstellar < 109 M⊙ whose distance to the LISA source is smaller than 8 Mpc. Black dots represent galaxies that never experienced a merger or a merger that happened more than 2 Gyr ago. Red dots correspond to galaxies that experienced at least one major merger in the last 2 Gyr. Blue dots display the galaxies that experience a merger with a mass ratio of 0.01 < mR < 0.2 in the last 2 Gyr.
Current usage metrics show cumulative count of Article Views (full-text article views including HTML views, PDF and ePub downloads, according to the available data) and Abstracts Views on Vision4Press platform.
Data correspond to usage on the plateform after 2015. The current usage metrics is available 48-96 hours after online publication and is updated daily on week days.
Initial download of the metrics may take a while.